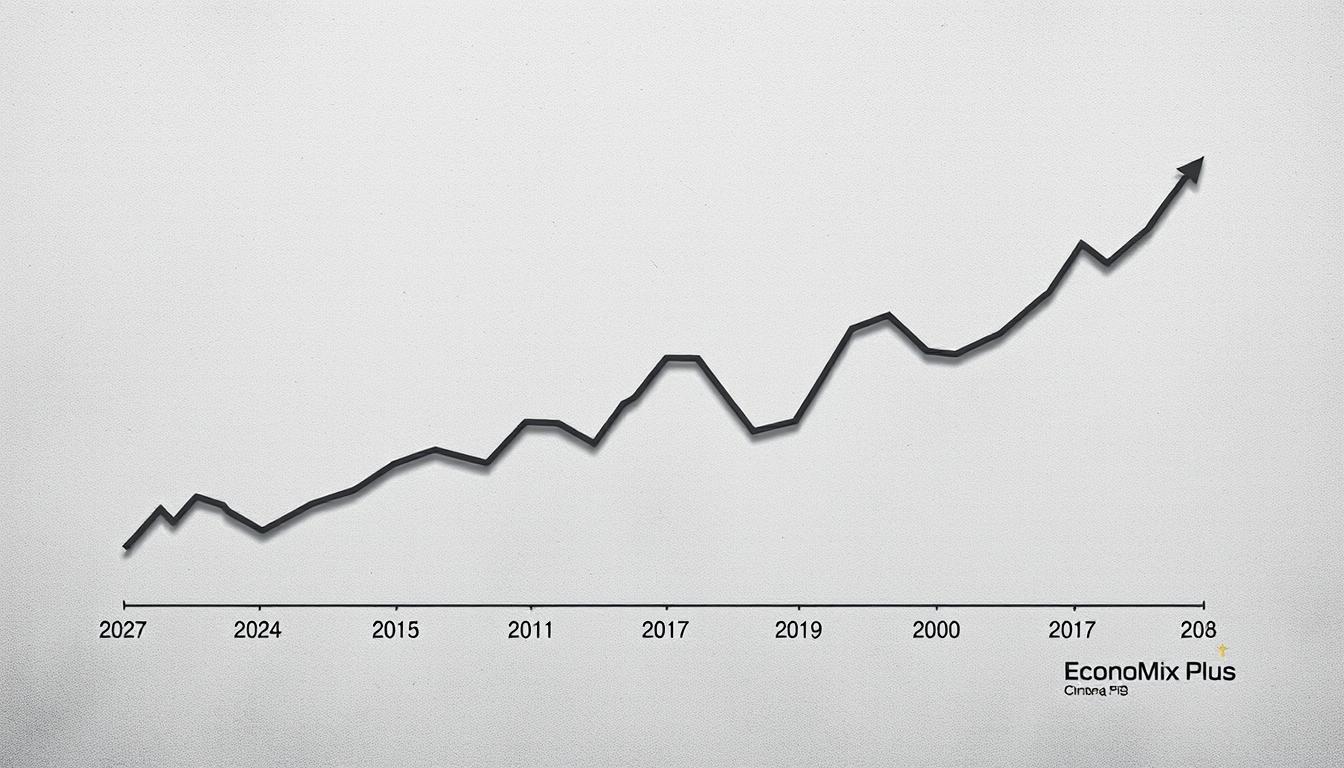
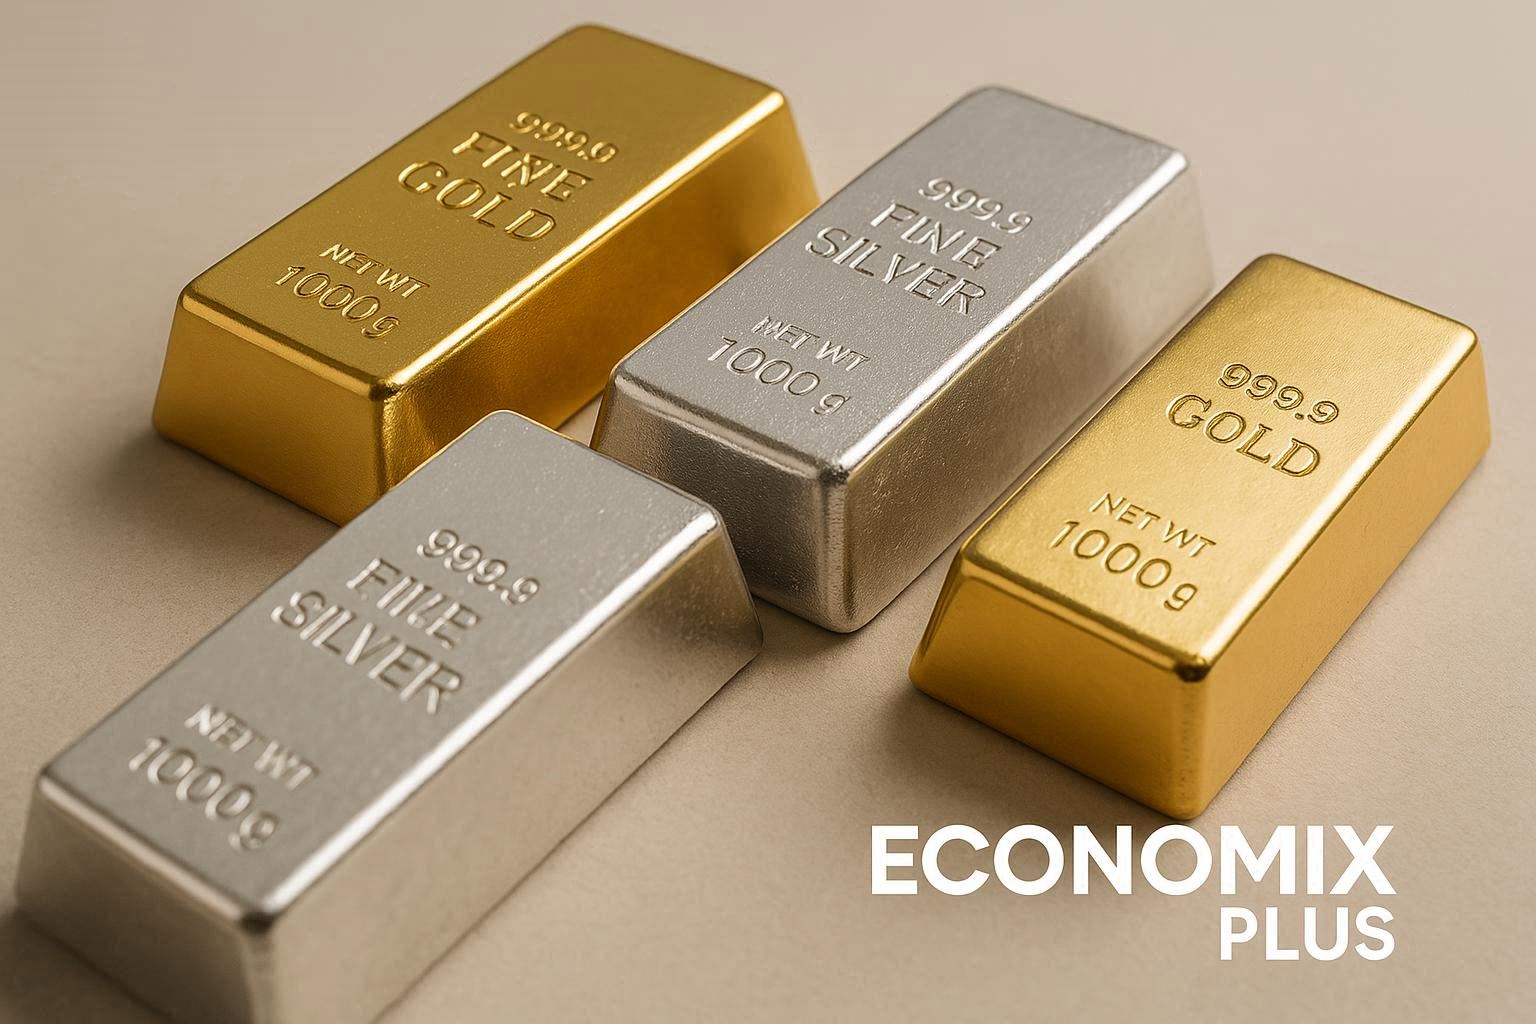
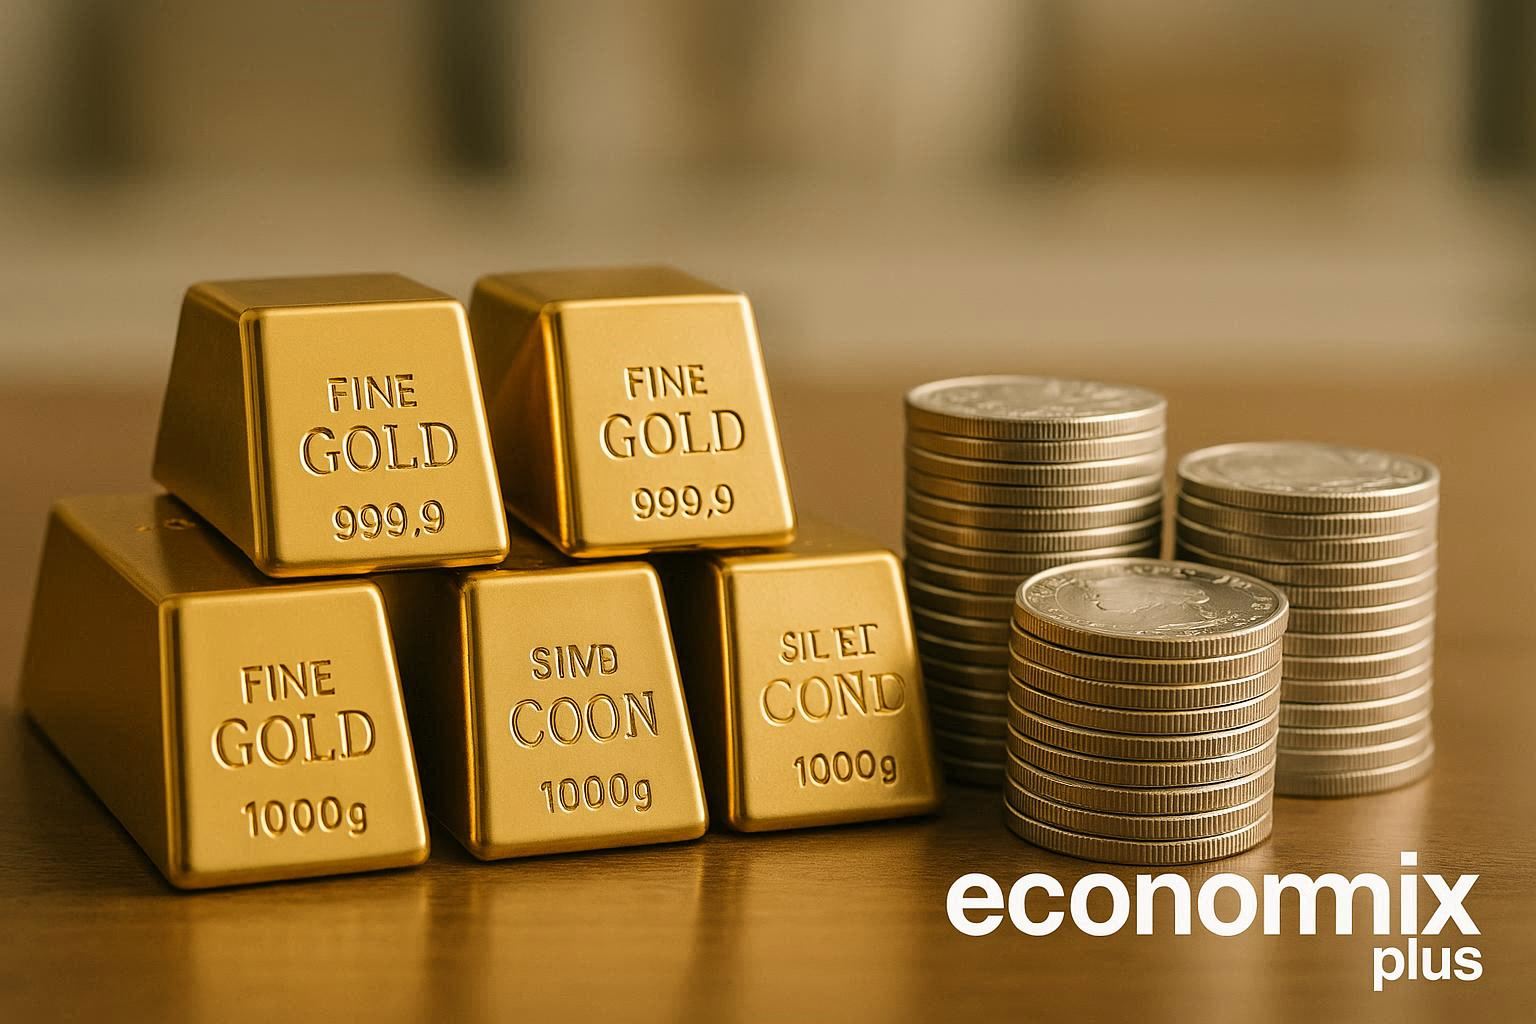
Modern technology relies on a surprising element: silver. This shiny metal powers solar panels, electric vehicles, and medical devices. But could its industrial applications directly affect your financial decisions? With prices surging 21.46% in the past year, understanding this connection matters more than ever.
Unlike gold, silver serves two masters. Investors view it as a store of value, while manufacturers need it for cutting-edge technologies. Renewable energy sectors alone consume over 100 million ounces annually. Even small changes in production or consumption create ripples in this compact market.
Consider this: 60% of silver demand now comes from industrial uses. From 5G infrastructure to AI-powered devices, innovation fuels new applications daily. When factories ramp up production, they compete directly with your portfolio for limited resources.
Key Takeaways
- Silver spot prices jumped 21% in 2024 – the largest gain in a decade
- Industrial needs now dominate over traditional jewelry and investment demand
- Green tech sectors account for 35% of total industrial consumption
- Market volatility stems from tight supply meeting growing applications
- Price swings often reflect manufacturing trends more than investor sentiment
Overview of Silver Market Dynamics and Industrial Demand
Two faces of silver: wealth preservation meets modern manufacturing essentials. This dual identity creates a market where jewelry stores and tech labs compete for the same resource. Over half (55%) of global consumption now flows to factories rather than safes—a seismic shift from historical patterns.
When Bullion Meets Circuit Boards
Your retirement portfolio and smartphone share an unlikely connection. As a precious metal industrial asset, silver protects savings during inflation. Yet those same ounces might end up in solar panels or medical equipment. This metal industrial commodity duality explains why shortages hit harder than in single-purpose markets.
The Squeeze Behind the Shine
Production hasn’t kept pace with tech’s hunger. Mining output plateaued in 2014 while above-ground stockpiles dwindled 38%. Meanwhile, green tech demands keep climbing:
- Each electric vehicle uses 1-2 ounces
- Solar panel arrays require 20 million ounces annually
- 5G networks need silver-coated components
“You’re witnessing a perfect storm,” observes a Wall Street metals analyst. “Limited supply collides with endless innovation.” Tiny market fluctuations now ripple through global trade, proving that even ancient elements face modern pressures.
Exploring the Impact of Industrial Applications on Silver Prices
Electric cars are racing toward a silver-dependent future. Every tech upgrade and green initiative tightens the metal’s supply chain, creating visible effects on global markets. Renewable energy sectors now consume 200 million ounces yearly—enough to plate 4 billion smartphones.

The Role of Electronics, Solar Energy, and Electric Vehicles
Your devices contain hidden silver layers. A single smartphone uses 0.3 grams, while solar panels require 20 million ounces annually. This table shows key consumption areas:
| Application | Annual Usage (Million oz) | Gold Comparison |
|---|---|---|
| Consumer Electronics | 48 | 6x more than gold |
| Solar Panels | 200 | Not used in PV cells |
| Electric Vehicles | 16 | 50x more per unit |
EVs use 1.5 ounces per vehicle—triple traditional cars. This surge explains why silver demand grew 8% last year. Unlike gold’s 10% industrial use, over half of mined silver feeds factories.
“Every solar farm built tightens the market further,” notes a JP Morgan commodities report. When manufacturers and investors both want limited stocks, price swings become inevitable. Your portfolio feels these shifts within weeks of production changes.
Does Industrial Demand Drive Silver Prices Up?
A tug-of-war shapes the silver market. While factories consume 60% of annual supply, investment flows often override production realities. Consider 2023: industrial usage grew 4%, yet prices dipped 9% as ETF outflows drained reserves.
| Price Driver | Impact Level | 2023 Example |
|---|---|---|
| Manufacturing Needs | Long-term | +200M oz solar demand |
| ETF Activity | Immediate | -$1.50/oz monthly swings |
| Mining Output | Delayed | 3-year project lead times |
Mining challenges amplify volatility. Only 30% of silver mining comes from primary sources—most gets extracted alongside copper or zinc. When base metal production slows, silver supply shrinks regardless of its own demand.
History shows patterns. The 2016 rally saw prices jump 50% despite flat industrial use. Why? ETF holdings ballooned to record levels. “Investors move markets faster than smelters,” notes a Silver Institute report.
Your portfolio faces dual pressures. While green tech expands, precious metals traders can flip markets overnight. Last quarter, ETF transactions shifted 300 million ounces—triple annual industrial consumption.
This duality creates opportunities. Watch COMEX inventories and mining permits. When both tighten, even modest demand silver spikes trigger outsized price reactions. The real question isn’t which force dominates, but how their collision reshapes your wealth.
Renewable Energy and Its Influence on Silver Consumption
Clean energy revolutions are rewriting the rules of resource markets. Solar farms and electric vehicle factories now compete with jewelry makers for this versatile precious metal. Current data shows renewable tech consumes one-fifth of global supply—a figure projected to double by 2030.

Solar Panel Growth and Silver Usage
Every solar panel contains roughly 0.7 ounces of silver—enough to power a home for decades. Installations surged 35% last year, driving consumption to 200 million ounces annually. This hunger directly impacts the spot price, with manufacturers often paying premiums during supply crunches.
Market analysts track photovoltaic demand through per ounce pricing trends. When solar companies stockpile materials, exchange inventories shrink. Your investment strategy needs real-time price tracking—a 10% spike in panel production can lift values 6% within weeks.
The Rise of Electric Vehicles and 5G Technology
Electric cars and 5G networks add pressure. Each EV battery uses 1.5 ounces, while 5G antennas require silver-coated components. Combined, these technologies could consume 50 million ounces yearly by 2025.
“Renewables aren’t a niche anymore—they’re market makers,” states a BloombergNEF report. Savvy investors watch industrial consumption patterns alongside COMEX futures. Monitoring the spot price per ounce reveals when tech demand outpaces mining output.
Your next move? Bookmark live pricing charts. As factories absorb more physical metal, every dollar fluctuation in the per ounce rate signals shifting profit potentials. This precious metal’s future shines brightest where sunlight meets silicon.
Analysis of Silver Supply Constraints and Mining Challenges
Mining operations face mounting obstacles as global consumption rises. Despite technological advances, annual output remains stuck at 2014 levels—around 900 million ounces. This stagnation occurs while factories devour record amounts for clean energy tech.

Limited Production and Stagnant Supply Growth
Extracting the metal grows harder each year. Ore grades have dropped 23% since 2010, forcing companies to dig deeper and process more rock. Production costs jumped 18% last year alone, squeezing profit margins.
Global supply hasn’t exceeded 1 billion ounces since 2016. Even with minor gains, renewable energy and electric vehicle sectors absorb nearly all new output. Analysts note a 40% decline in above-ground stockpiles over the past decade.
Tight inventories amplify market reactions. When solar panel makers or EV manufacturers boost orders, even small surges create price spikes. Last quarter, a 5% rise in renewable energy projects correlated with a 3% jump in market value.
Innovation becomes critical. One mining CEO states: “We’re exploring AI-powered drilling to access deeper deposits.” Recycling programs recover 150 million ounces annually, but that barely meets half of green tech’s needs.
Permitting delays and environmental regulations stretch project timelines to 7-10 years. These bottlenecks ensure supply shortages will persist, making every ounce from new mines crucial for tomorrow’s technologies.
Investment Sentiment Versus Fundamental Supply-Demand Dynamics
Market forces collide where factory orders meet trading algorithms. While physical consumption relies on steady mining output and industrial applications, prices increasingly dance to investors’ digital rhythms. Exchange-traded products (ETPs) now hold 1.2 billion ounces—enough to supply all global solar panel makers for six years.
How Exchange Traded Products (ETPs) Affect Price Movements
ETPs amplify market swings. When investors flood in, prices detach from ground realities. Consider 2020: ETP holdings grew 150 million ounces in three months, driving a 47% price surge. Industrial use only rose 3% that year.
| Year | ETP Holdings Change | Price Change | Industrial Growth |
|---|---|---|---|
| 2020 | +150M oz | +47% | +3% |
| 2023 | -80M oz | -9% | +4% |
*Data reflects correlation between paper markets and physical demand
The gold-silver ratio acts as a trader’s compass. When it exceeds 80:1, investors often pivot to the cheaper metal. This happened in 2011, triggering record ETP inflows that outpaced mining production by 4:1.
Technical levels matter too. Prices repeatedly stall near $30/oz—a resistance point shaped by decades of industrial applications data. “ETPs can override fundamentals temporarily,” notes a Bloomberg analyst, “but mining costs and solar panel demand always reset the floor.”
Your strategy? Watch COMEX inventories and the gold-silver ratio simultaneously. When both signal scarcity, even modest ETP buying can spark rallies that defy factory consumption trends.
Gold-Silver Ratio: A Key Indicator for Silver Investors
Traders have tracked the gold-silver ratio for centuries, but modern markets give this metric explosive relevance. Currently at 85:1, it takes 85 ounces to buy one ounce of gold—a signal that industrial-focused metal industrial assets might be undervalued. This ratio historically averaged 55:1, with extremes like 100:1 in 2020 highlighting rare opportunities.
Decoding Market Signals Through Time
When the ratio climbs above 80:1, silver often rallies within 12-18 months. The 2011 surge saw prices triple as the ratio collapsed from 65:1 to 31:1. Today’s elevated levels suggest similar potential, especially with growing demand from solar panel manufacturers and EV producers.
Three factors reshape this dynamic:
- Mining supply constraints limit available stocks
- Accelerating silver consumption in tech sectors
- Investor behavior during economic uncertainty
“High ratios act like coiled springs,” notes a Metals Focus analyst. “When metal industrial needs collide with tight inventories, silver outperforms gold by wide margins.”
Your analysis should track two datasets: COMEX stock levels and photovoltaic installation rates. With renewable projects consuming 200M ounces annually, even minor supply disruptions amplify price moves. The ratio’s recent peak mirrors conditions before the 2016 rally, when silver gained 50% in six months.
Watch for these triggers:
- Mine output declines exceeding 5%
- Quarterly silver consumption growth above 3%
- ETF inflows surpassing 50M ounces
While gold dominates safe-haven talk, silver’s dual role as a metal industrial workhorse and monetary asset creates unique leverage. Current growing demand patterns suggest the 85:1 ratio won’t last—knowledge that could shape your next portfolio adjustment.
Technical Analysis: Identifying Key Price Levels for Silver
Chart patterns reveal hidden battles between buyers and sellers. For this industrial commodity, the $35-37 range acts as a make-or-break zone. Technical studies show prices stalled here 14 times since 2012—a resistance wall thicker than vault doors.
- Support: $24.50 (2023 low) and $26.80 (200-day moving average)
- Resistance: $30 (psychological barrier) and $35-37 (decade-high cluster)
The Relative Strength Index (RSI) often signals shifts before price moves. In 2020, RSI divergence at 75 foreshadowed a 15% drop within weeks. “Technical breaks impact silver faster than other metals,” notes a CME Group analyst. “Its industrial commodity status creates explosive volatility.”
| Historical Breakout | Resistance Level | Result |
|---|---|---|
| 2011 Peak | $49.51 | 54% correction |
| 2020 Rally | $30 | 47% gain |
| 2023 Dip | $26.80 | 9% rebound |
Why believe silver follows technicals so closely? Its dual role as monetary asset and industrial commodity amplifies pattern reliability. When 50-day and 200-day moving averages cross—called the “golden cross”—prices rallied 33% on average since 2000.
Combine chart signals with factory demand data. If solar panel orders spike while prices test $35, expect fireworks. One trader’s mantra: “Technical breaks impact silver prices first—fundamentals explain why later.”
Your playbook? Watch Fibonacci retracements during pullbacks. The 61.8% level ($27.40) supported three major rallies since 2019. Pair this with COT reports tracking commercial trader positions—when they believe silver’s undervalued, rallies often follow.
Historical Context: Silver’s Role as Money and Industrial Commodity
Centuries before powering tech, silver built empires through trade. Ancient Lydia stamped it into coins around 600 BCE, creating the first standardized currency. By 1873, governments had demonetized it, but its market dynamics still echo through modern finance.
Your smartphone shares DNA with Spanish doubloons. Both rely on silver’s unique blend of conductivity and malleability. Roman mines produced 200 tons annually for coins—today, factories use that much every month for solar panels.
Three factors bridge past and present:
- Scarcity drove ancient economies, just as tight supplies pressure green tech now
- Minting purity standards mirror today’s industrial-grade specifications
- Price swings followed discovery of New World deposits, similar to modern mining finds
“Silver’s unique duality isn’t new—it’s evolution,” notes a Yale economic historian. When Rome fell, silver hoards lost monetary value but gained industrial purpose in medieval alchemy. Today’s market dynamics replay this script with circuit boards replacing crucibles.
Understanding these factors helps decode price patterns. The 19th-century gold/silver ratio of 16:1 now exceeds 80:1, yet energy sector demand creates new valuation anchors. Your investment strategy gains depth when history illuminates the charts.
Future Outlook: Industrial Demand Trends and Market Projections
Tomorrow’s factories will hunger for more metal than ever before. Analysts forecast 12% annual growth in consumption through 2030, driven by solar innovations and AI infrastructure. Renewable energy sectors could devour 300 million ounces yearly by 2025—enough to plate every smartphone on Earth twice.
Growth Projections in Industrial Consumption
Three sectors will dominate expansion:
- Solar panel production: +40% capacity by 2026
- Electric vehicles: 25 million units needing 1.8 ounces each
- 5G networks: 500,000 new towers requiring silver-coated components
Medical tech adds another layer. Antimicrobial coatings in hospitals could consume 15 million ounces annually—triple current usage.
Potential Catalysts for Price Appreciation
Supply chains face unprecedented strain. Mining output must increase 8% yearly to meet projected needs—a target no major producer has hit since 2012. This table shows the widening gap:
| Sector | 2025 Projected Demand | 2030 Projected Demand |
|---|---|---|
| Renewable Energy | 220M oz | 340M oz |
| Electronics | 85M oz | 120M oz |
| Automotive | 28M oz | 45M oz |
“The ratio of consumption to production will dictate market moves,” states a Goldman Sachs metals strategist. When stockpiles drop below 6 months’ supply—projected for late 2025—prices could breach $50/oz.
Your advantage lies in tracking innovation cycles. Next-gen photovoltaic cells use 20% more metal per panel. Each efficiency breakthrough strengthens silver’s role in clean energy transitions. These shifts create compounding pressure that could redefine valuation models within five years.
Strategic Investment Insights for Navigating Silver Markets
Navigating the silver market requires blending physical holdings with industrial exposure. A balanced portfolio often outperforms single-asset strategies, particularly when production bottlenecks meet rising tech demand. Historical data shows diversified approaches delivered 22% annual returns since 2015—outpacing pure bullion investments by 9%.
| Asset Type | Volatility | 5-Year Return | Industrial Exposure |
|---|---|---|---|
| Physical Silver | 25% | +40% | Low |
| Mining Stocks | 35% | +85% | High |
| Silver ETFs | 28% | +52% | Moderate |
| Tech Sector Stocks | 32% | +110% | Direct |
Current markets favor miners with low-cost operations. Companies extracting silver as a byproduct from copper/zinc mines often weather price swings better. “Diversification acts as shock absorbers,” notes a BlackRock commodities strategist. “When applications surge, mining equities amplify gains while physical metal preserves capital.”
Monitor these industry signals monthly:
- Mine output reports from Mexico and Peru
- Patent filings for new tech applications
- Warehouse stock levels at COMEX
Risk management remains critical. Allocate 40% to physical assets, 30% to mining stocks, and 30% to growth sectors like renewable energy firms. This mix leverages silver’s dual role in markets while hedging against production delays or demand shifts.
Rebalance quarterly using industry consumption data. When solar panel orders spike, increase mining exposure. If ETF outflows dominate, boost physical holdings. This dynamic approach turns silver’s volatility into strategic advantage.
Divergence Between Industrial and Investment Demand: What It Means for You
Market forces pull silver in two directions—factories and financial instruments often want opposite outcomes. When spot prices diverge from physical consumption trends, your portfolio faces critical decisions. Recent data shows industrial users bought 18% more metal last quarter while ETF investors sold 23% of holdings.
This gap creates windows of opportunity. Prices temporarily dip when paper markets panic, even as solar panel makers stockpile materials. Savvy investors track COMEX inventories against manufacturing orders to spot mismatches.
Balancing Physical Silver and Mining Equities
Physical metal stabilizes portfolios during ETF sell-offs, while mining stocks amplify gains when spot prices rise. Consider this comparison:
| Asset Type | Correlation to Spot Price | Industrial Exposure | 2024 YTD Performance |
|---|---|---|---|
| Bullion | 0.92 | Low | +14% |
| Mining ETFs | 1.35 | High | +27% |
| Tech Sector Stocks | 0.68 | Direct | +19% |
Allocate based on risk tolerance. Physical holdings provide stability when investor sentiment overshadows factory demand. Mining equities outperform during sustained spot price rallies driven by tech sector growth.
Watch these signals to time entries:
- ETF outflows exceeding 50M ounces/month
- Solar panel production forecasts rising >5% quarterly
- Spot price dips below 200-day moving average
“Divergence periods let you buy undervalued metal before manufacturers drain inventories,” notes a Fidelity portfolio manager. “Combine technical breaks with shipping data from Asian tech hubs.”
Rebalance quarterly using both analyses. Fundamental metrics reveal long-term value, while chart patterns pinpoint short-term opportunities. When factories and funds disagree, your strategy should bridge the gap.
Conclusion
The market’s delicate balance hinges on competing priorities. Factories and investors battle for limited ounces, creating price patterns that reward strategic observers. Over 60% of annual supply now fuels innovation, while financial instruments amplify short-term swings.
Monitoring both fundamentals and technicals proves critical. Spot prices per ounce often reflect manufacturing needs before broader trends emerge. Recent projections suggest surging industrial demand could push values toward $35 per ounce by 2025—a 40% leap from current levels.
Three insights shape opportunities:
- Dual identity: Acts as both wealth preservation tool and tech-sector linchpin
- Supply squeeze: Mining struggles to meet renewable energy’s hunger for ounces
- Timing tools: Spot price trends and inventory data signal entry points
Your advantage lies in tracking ounce-based metrics alongside production forecasts. When solar expansions clash with ETF outflows, volatility becomes your ally. Stay alert to resistance levels near $30 per ounce—breaks here often precede sustained rallies.
As factories and funds vie for dominance, silver’s story remains unwritten. Each technological leap tightens supply chains further, making every ounce count in tomorrow’s economy.
FAQ
How does silver’s dual role as a precious metal and industrial commodity affect its value?
Silver’s value is influenced by both investment demand and industrial use. While investors treat it like gold for hedging against inflation, industries rely on it for electronics, solar panels, and medical devices. This dual demand creates unique price dynamics compared to other metals.
Why is renewable energy a major driver of silver consumption?
Solar panels and electric vehicles require silver for conductive properties. Each solar panel uses ~20 grams, and EVs need silver for electrical components. As renewable energy adoption grows, this sector could consume over 100 million ounces annually by 2030, pushing prices higher.
What challenges are affecting silver mining and supply growth?
Over 70% of silver comes as a byproduct of mining other metals like copper and zinc. Stagnant production, declining ore grades, and limited new projects constrain supply. Annual output has hovered around 800 million ounces since 2015, tightening the market.
How do investment products like ETPs influence silver prices?
Exchange-traded products (ETPs) allow investors to gain exposure without holding physical metal. Large inflows or outflows from funds like iShares Silver Trust (SLV) can cause short-term price swings, sometimes decoupling from industrial demand fundamentals.
What does the gold-silver ratio indicate for investors?
The ratio measures how many ounces of silver buy one ounce of gold. Historically, it averages 60:1. When the ratio rises above 80 (as in 2020), silver is considered undervalued relative to gold, signaling potential buying opportunities for traders.
Which key price levels should you watch in technical analysis?
The $28-$30 per ounce range is critical resistance. A sustained breakout above $30 could signal a long-term bullish trend. Support levels near $22-$24 often attract buyers during pullbacks, creating a trading range for short-term investors.
How has silver’s historical role shaped its modern market?
Silver served as currency for centuries, creating lasting investment appeal. Today, its industrial applications dominate, with over 50% of demand coming from sectors like electronics and green tech. This blend of monetary history and modern utility makes it unique among commodities.
What growth trends could push silver prices higher?
Solar energy expansion, 5G infrastructure rollout, and EV adoption are key catalysts. Analysts project industrial demand could grow 5-8% annually through 2030. If supply remains constrained, this imbalance may drive sustained price appreciation.
How can you strategically invest in silver markets?
Consider diversifying between physical holdings (coins, bars) and mining stocks. Companies like Pan American Silver (PAAS) offer leverage to rising prices, while ETFs like SIVR provide direct exposure. Monitor both industrial data and macroeconomic trends for timing entries.
What does the divergence between industrial and investment demand mean for you?
While industrial demand provides long-term price support, investment flows drive volatility. Balancing exposure through physical assets and equities helps manage risk. Watch for shifts in Fed policy or green energy incentives, which often trigger major price moves.
