Economic policies shape the nation’s financial landscape for generations, influencing everything from job markets to global trade relationships. Donald Trump’s presidency marked a distinctive approach to economic governance, but how transformative was it compared to other administrations? This comprehensive analysis examines Trump’s economic agenda against those of other notable U.S. presidents, using objective data to determine which administration enacted more substantial economic change.
By examining fiscal policy, trade agreements, tax reforms, employment metrics, and industrial strategies across multiple presidencies, we can better understand the unique aspects of Trump’s economic approach and its lasting impact on American economic structures. This data-driven comparison offers insights beyond partisan narratives, focusing instead on measurable outcomes and policy consequences.
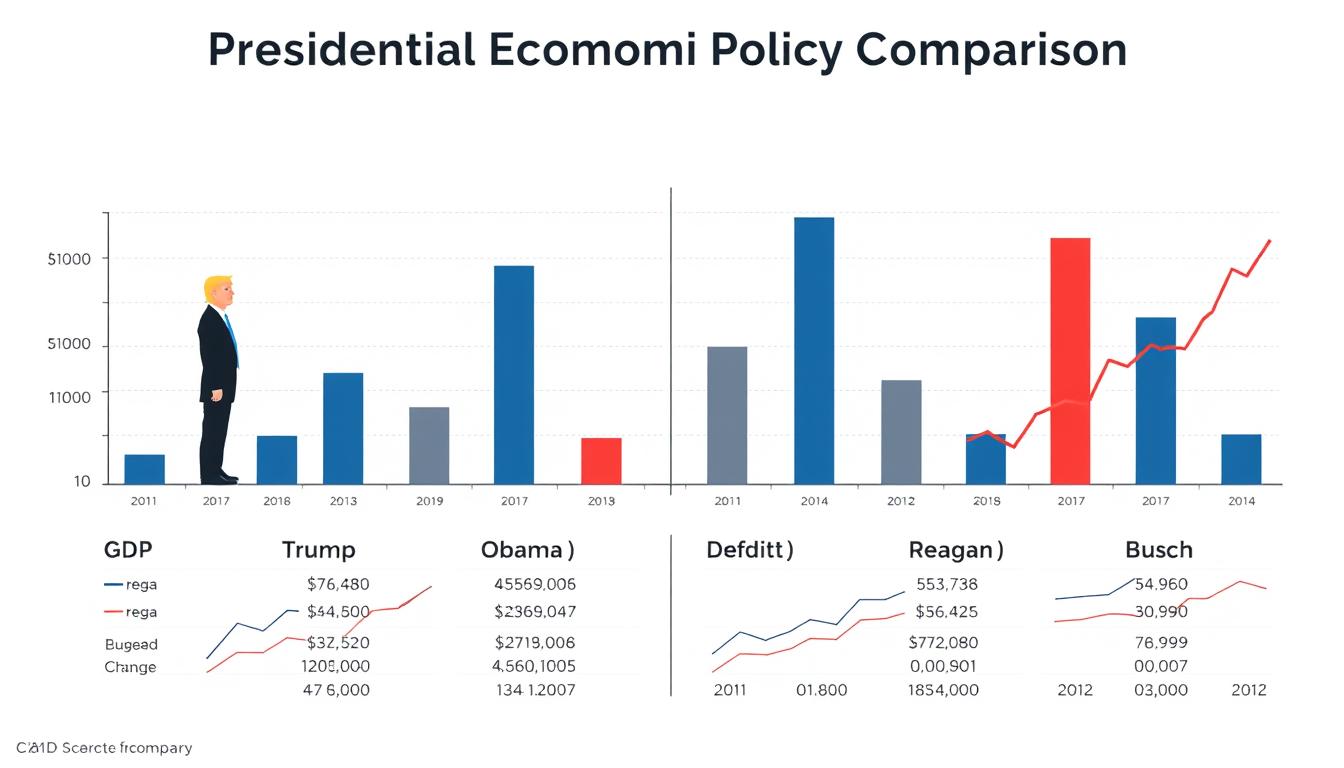
Comparative economic metrics across recent presidential administrations
Economic Philosophy and Ideological Foundation
Each president brings a distinct economic philosophy to the White House, shaping their approach to government intervention, market regulation, and fiscal priorities. Trump’s economic ideology represented a hybrid approach that both aligned with and diverged from traditional Republican economic thinking.
Trump’s Economic Worldview
Donald Trump’s economic philosophy combined elements of traditional Republican supply-side economics with a more nationalist, protectionist approach to trade and industry. Unlike the free-market orientation of Reagan or Bush, Trump embraced a more interventionist stance on international commerce while maintaining traditional conservative positions on taxation and regulation.
The Trump administration’s economic worldview was characterized by:
- Economic nationalism prioritizing domestic industries
- Skepticism toward multilateral trade agreements
- Traditional Republican tax reduction policies
- Aggressive deregulation across multiple sectors
- Willingness to use tariffs as economic leverage
Comparative Presidential Philosophies
Reagan’s administration championed supply-side economics, emphasizing tax cuts and deregulation to stimulate growth. Clinton embraced a “Third Way” approach, balancing market-friendly policies with targeted government programs. Bush continued Reagan’s supply-side approach while expanding government in response to national security concerns. Obama implemented Keynesian stimulus during the Great Recession while expanding the government’s role in healthcare.
Biden’s administration has pursued a more interventionist industrial policy, focusing on climate initiatives, infrastructure investment, and domestic manufacturing support. This represents a significant departure from the market-oriented approaches of previous decades.
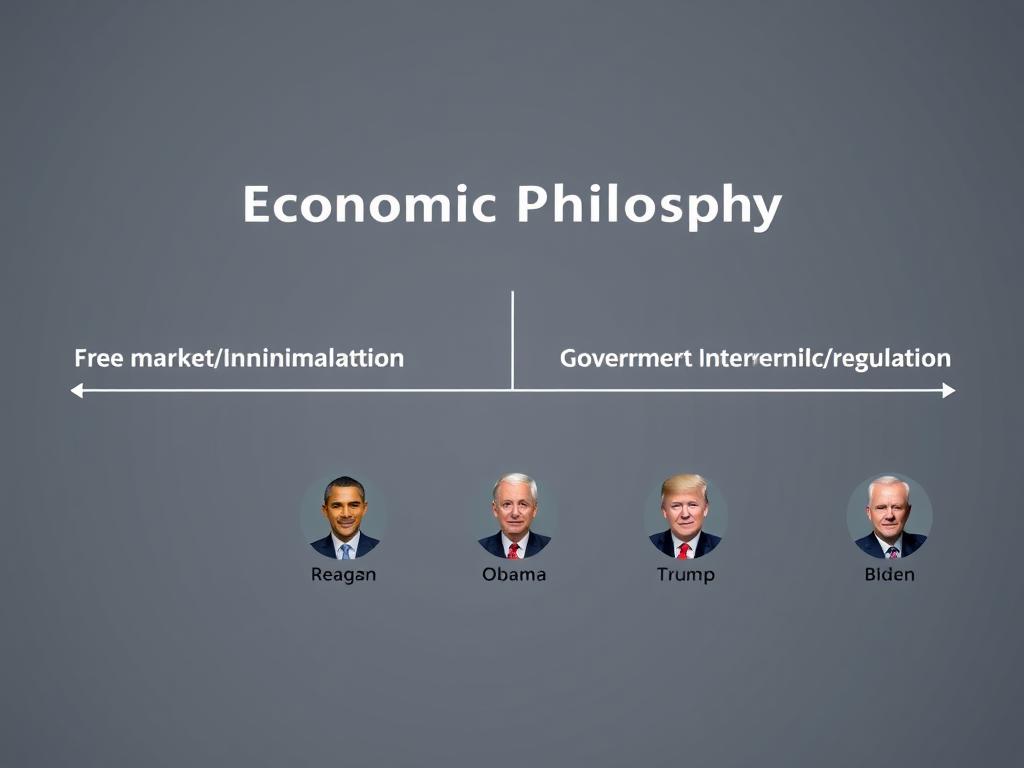
Economic philosophy spectrum across presidential administrations
While Trump maintained traditional Republican positions on taxation and regulation, his willingness to use tariffs and government influence to reshape trade relationships represented a significant departure from the free-trade orthodoxy that had dominated both parties since the Reagan era. This hybrid approach created a distinctive economic framework that neither fully aligned with traditional conservatism nor embraced progressive economic policies.
Key Insight: Trump’s economic philosophy represented a break from the bipartisan consensus on free trade that had dominated American policy since the 1980s, while maintaining traditional Republican approaches to taxation and regulation.
Taxation and Fiscal Policy
Tax policy represents one of the most direct ways presidents influence economic activity. The 2017 Tax Cuts and Jobs Act (TCJA) stands as Trump’s signature fiscal achievement, warranting careful comparison with tax reforms under previous administrations.
The 2017 Tax Cuts and Jobs Act
The TCJA represented the most significant tax overhaul since the Reagan administration, reducing the corporate tax rate from 35% to 21% and implementing temporary individual tax cuts across income brackets. According to the Congressional Budget Office, the TCJA was projected to increase the federal deficit by approximately $1.5 trillion over a ten-year period.
| Tax Policy Element | Trump (TCJA) | Reagan (1981/1986) | Bush (2001/2003) | Obama |
| Corporate Tax Rate | Reduced from 35% to 21% | Reduced from 46% to 34% | No major change | No major change |
| Top Individual Rate | Reduced from 39.6% to 37% | Reduced from 70% to 28% | Reduced from 39.6% to 35% | Increased to 39.6% for high earners |
| Estate Tax | Doubled exemption to $11.2M | Increased exemption | Phased reduction | Permanent $5M exemption |
| Deficit Impact (% of GDP) | +0.7% annually | +0.8% annually | +0.5% annually | -0.1% (tax increases) |
Comparative Fiscal Outcomes
While the TCJA’s corporate tax cuts were permanent, individual tax reductions were designed to expire after 2025, creating a fiscal cliff that future administrations must address. This approach differs from Reagan’s 1986 tax reform, which was more comprehensively structured for long-term implementation.
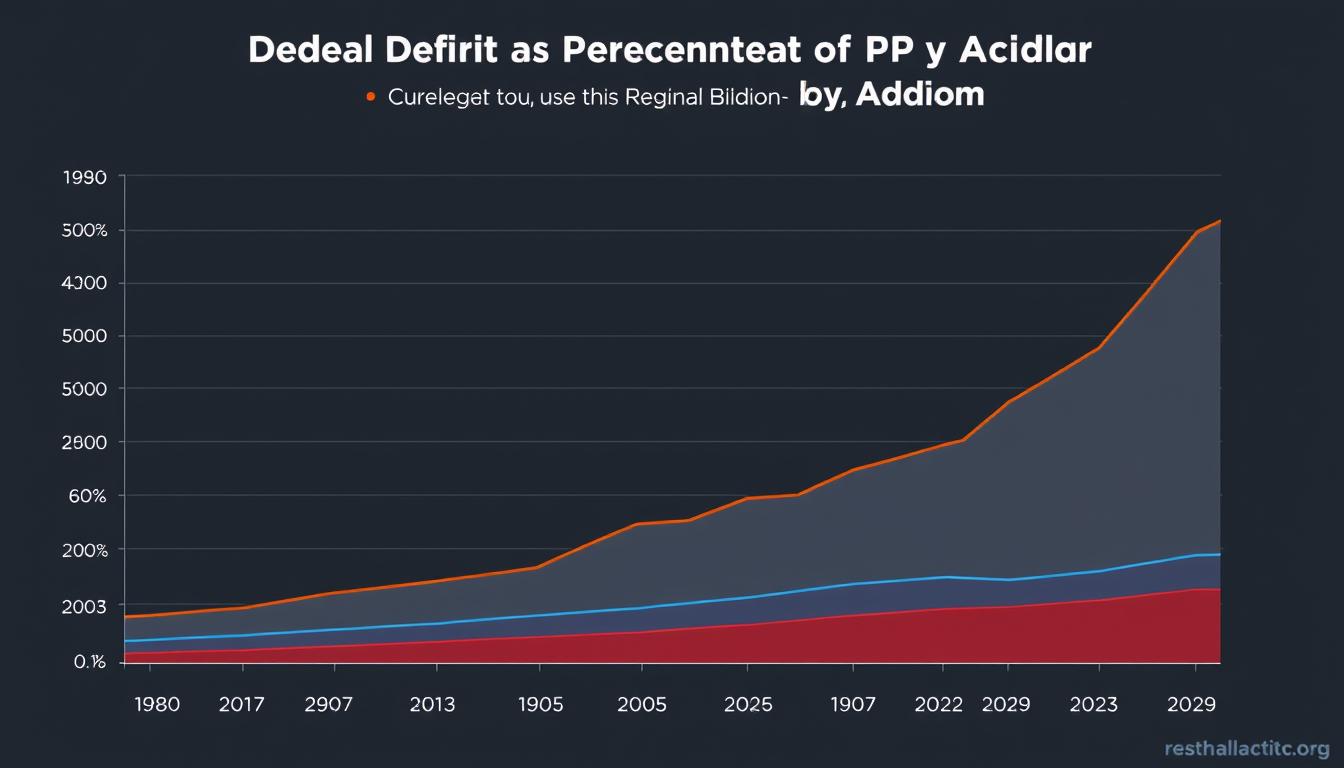
Federal deficit as percentage of GDP across presidential administrations
According to the Congressional Budget Office, the federal deficit increased from 3.5% of GDP in 2017 to 4.6% in 2019, before pandemic spending drove it significantly higher. This increase occurred during a period of economic expansion, contrasting with the deficit reduction achieved during the Clinton and late Obama years.
“While the Tax Cuts and Jobs Act did stimulate short-term growth and business investment, its impact on long-term productivity growth remains less clear. The corporate tax cuts did not pay for themselves as some proponents claimed they would.”
Data from the Federal Reserve shows that while business investment increased immediately following the TCJA’s implementation, the growth rate slowed significantly by 2019, suggesting the tax cuts provided a temporary rather than sustained boost to capital expenditure.
Key Data Point: According to the Congressional Budget Office, the federal debt held by the public increased from 76.1% of GDP in 2016 to 79.2% in 2019, before pandemic spending drove it to 100.1% by 2020.
Trade and Global Economic Policy
Trump’s “America First” approach to international trade represented one of the most significant departures from previous administrations, both Republican and Democratic. This section examines how Trump’s trade policies compared with those of his predecessors.
Tariff Implementation and Trade Wars
The Trump administration implemented tariffs on approximately $360 billion of imported goods, primarily from China but also on steel and aluminum from multiple countries including allies. This marked a sharp break from the free trade consensus that had dominated both parties since the Reagan era.
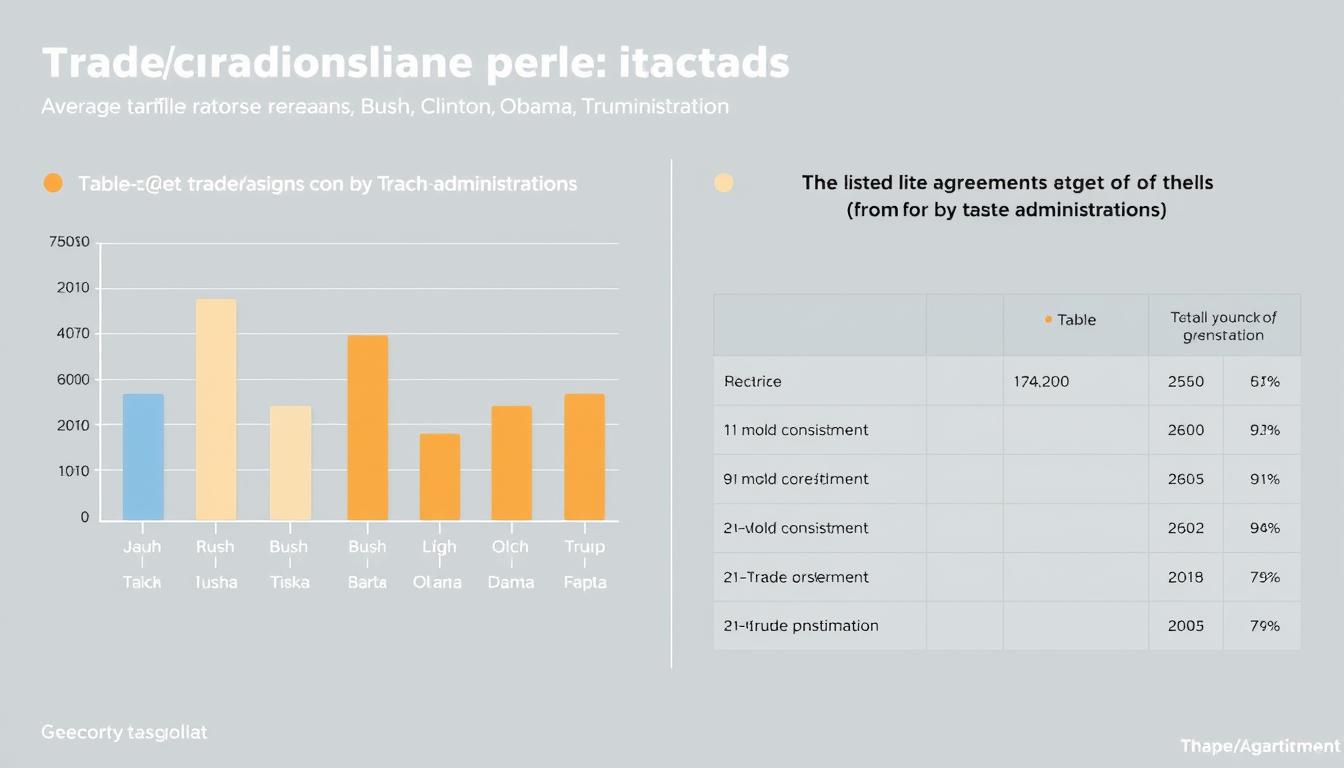
Tariff rates and trade agreement participation across administrations
According to a 2019 Federal Reserve study, Trump’s tariffs resulted in approximately $40 billion in additional costs for American businesses and consumers annually. The Peterson Institute for International Economics estimated that the average American household faced approximately $831 in additional costs due to tariffs by 2019.
Trade Agreement Renegotiation
Unlike previous administrations that pursued multilateral trade agreements, Trump withdrew from the Trans-Pacific Partnership (TPP) and renegotiated NAFTA into the USMCA. This approach contrasted sharply with Clinton’s NAFTA implementation, Bush’s pursuit of bilateral free trade agreements, and Obama’s TPP negotiations.
Trump’s Trade Approach
- Withdrawal from TPP
- Renegotiation of NAFTA into USMCA
- Extensive use of Section 232 and 301 tariffs
- Bilateral rather than multilateral negotiations
- Trade deficit reduction as primary metric
Previous Administrations
- Clinton: NAFTA implementation, WTO formation
- Bush: Multiple bilateral free trade agreements
- Obama: TPP negotiation, multilateral approach
- Reagan: GATT negotiations, market opening
- Biden: Partial continuation of China tariffs
The U.S. trade deficit, which Trump cited as a primary motivation for his trade policies, actually increased during his administration from $481 billion in 2016 to $577 billion in 2019, according to the Bureau of Economic Analysis. This highlights the complex relationship between tariff policies and trade balances.
“Trump’s trade policies represented the most significant shift in U.S. trade strategy since the early post-WWII period, moving away from the bipartisan consensus on trade liberalization toward a more nationalist, protectionist approach.”
Key Insight: While previous administrations occasionally used targeted tariffs, Trump’s widespread implementation of tariffs as a primary trade tool represented a fundamental shift in U.S. trade policy approach.
Employment and Labor Market Strategy
Labor market performance serves as a critical metric for evaluating economic policies. This section compares employment trends under Trump with those of previous administrations, accounting for external factors like COVID-19.
Pre-Pandemic Employment Trends
Prior to the COVID-19 pandemic, the Trump administration saw continued job growth, building on momentum from the Obama recovery. From January 2017 to February 2020, the economy added approximately 6.8 million jobs, according to the Bureau of Labor Statistics.
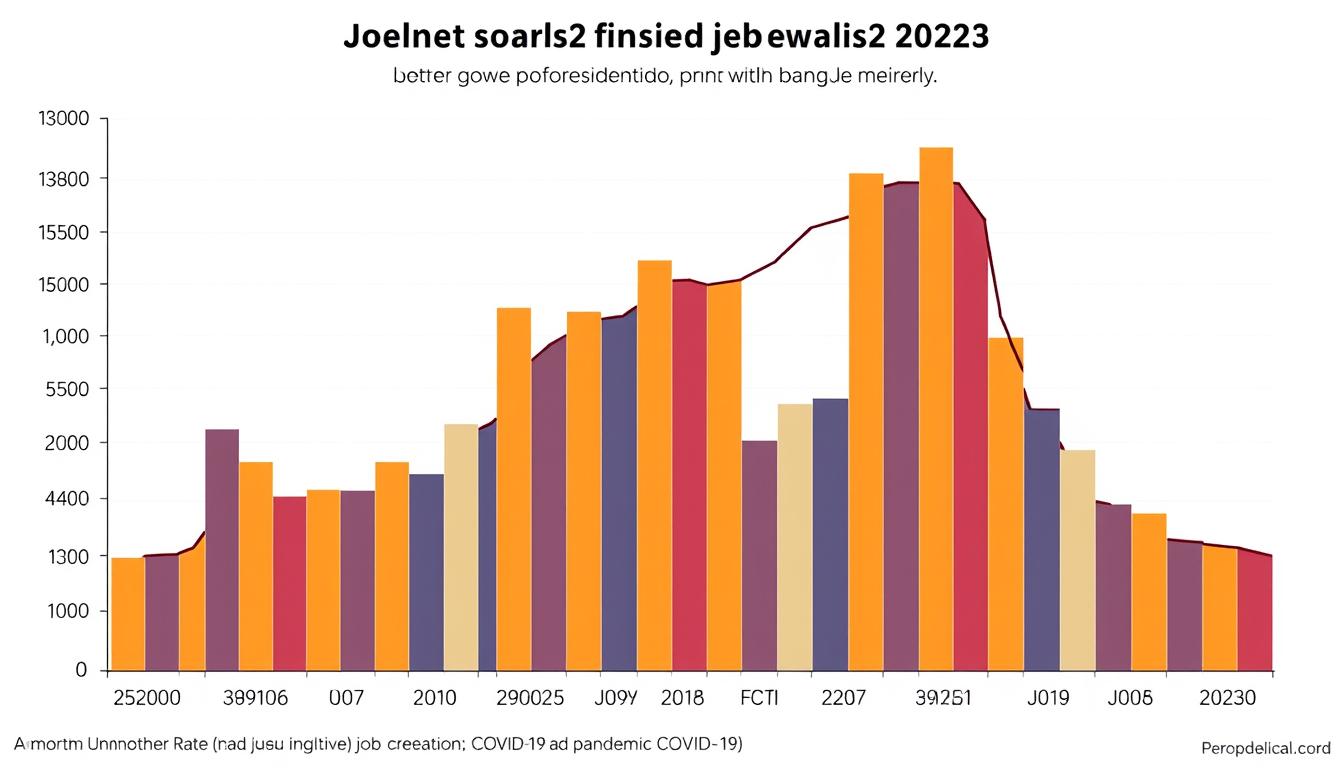
Unemployment rates and job creation across presidential terms
The unemployment rate fell from 4.7% when Trump took office to 3.5% by February 2020, reaching a 50-year low. However, this represented a continuation of trends from the Obama administration, which saw unemployment fall from 10% in 2009 to 4.7% by January 2017.
| Employment Metric | Trump (Pre-COVID) | Obama (Second Term) | Bush (Pre-2008 Crisis) | Clinton (Full Term) |
| Average Monthly Job Growth | 185,000 | 213,000 | 68,000 | 237,000 |
| Unemployment Rate Change | -1.2 percentage points | -2.2 percentage points | +0.3 percentage points | -3.9 percentage points |
| Labor Force Participation | Increased 0.6% | Decreased 1.5% | Decreased 1.1% | Increased 1.3% |
| Real Wage Growth (Annual) | 1.2% | 0.8% | 0.4% | 1.5% |
Pandemic Impact and Response
The COVID-19 pandemic triggered unprecedented job losses, with unemployment reaching 14.7% in April 2020. The Trump administration’s response included the CARES Act, which provided expanded unemployment benefits and the Paycheck Protection Program to preserve jobs.
By comparison, the Obama administration faced the 2008-2009 financial crisis, implementing the American Recovery and Reinvestment Act. The Reagan administration confronted high unemployment early in its term, while the Clinton years saw steady job growth without major economic crises.
“While pre-pandemic job growth under Trump continued positive trends from the Obama recovery, the administration’s response to COVID-19 job losses through the CARES Act represented one of the largest federal interventions in labor markets in U.S. history.”
Data from the Bureau of Labor Statistics shows that manufacturing employment, a particular focus of Trump’s economic messaging, increased by approximately 450,000 jobs from January 2017 to February 2020, before pandemic-related losses. This represented a modest acceleration from the manufacturing job growth in Obama’s second term.
Key Data Point: According to the Bureau of Labor Statistics, the labor force participation rate increased from 62.9% when Trump took office to 63.4% by February 2020, reversing some of the decline seen during the Obama years.
Manufacturing and Industrial Revival
Trump campaigned heavily on revitalizing American manufacturing and reshoring production from overseas, particularly from China. This section examines the outcomes of these efforts compared to industrial policies of previous administrations.
Manufacturing Employment and Output
Prior to the pandemic, manufacturing employment grew by approximately 450,000 jobs during Trump’s administration, according to the Bureau of Labor Statistics. This represented a continuation and slight acceleration of the manufacturing recovery that began in Obama’s second term after decades of decline.
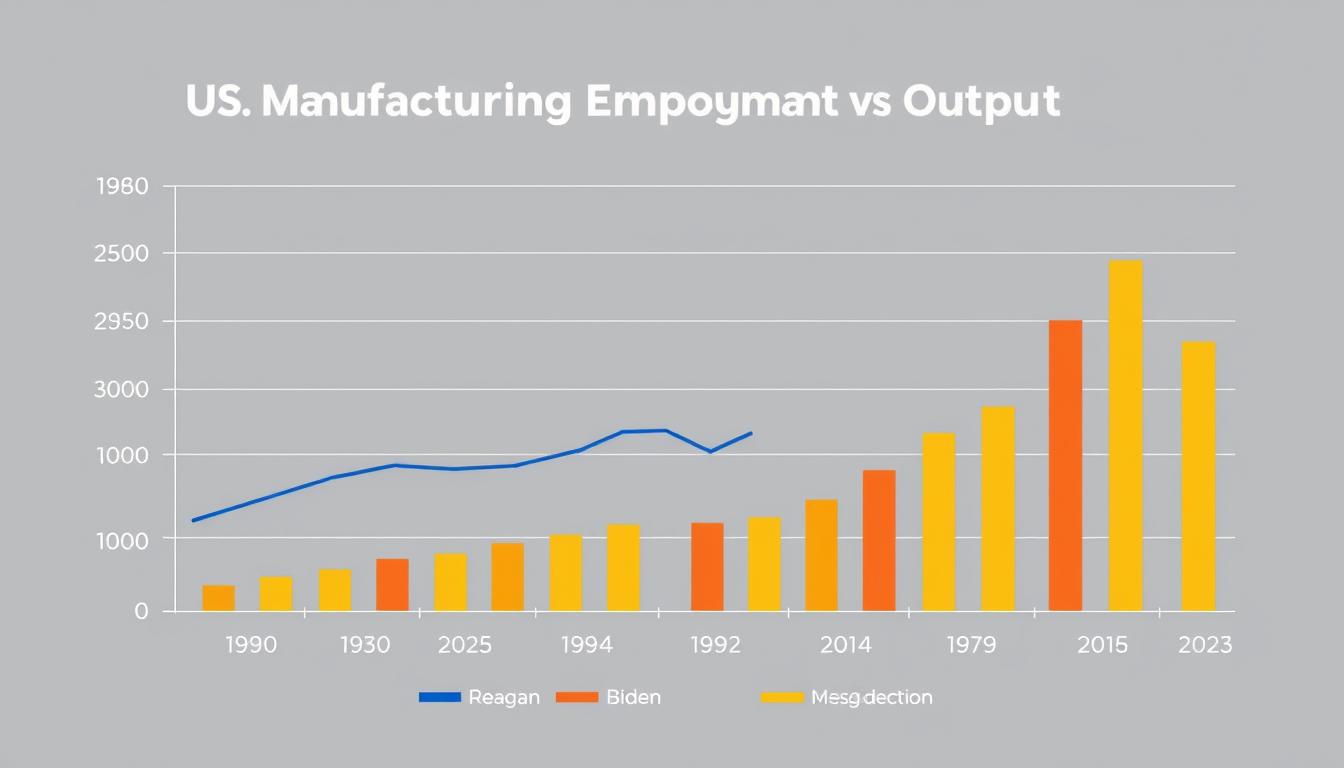
Manufacturing employment and output trends across presidential administrations
Manufacturing output, as measured by the Federal Reserve’s industrial production index, increased by approximately 3.6% from January 2017 to December 2019, before declining during the pandemic. This growth rate was comparable to that seen during Obama’s second term.
Reshoring and Supply Chain Policies
Trump’s approach to industrial policy focused heavily on using tariffs and tax incentives to encourage domestic production. This contrasted with Obama’s more targeted approach through the Manufacturing Extension Partnership and Advanced Manufacturing Partnerships, and with Reagan’s market-oriented approach that accepted manufacturing’s decline as part of economic evolution.
Trump’s Industrial Approach
- Broad tariffs on imported goods
- Corporate tax cuts to incentivize domestic investment
- Reduced environmental and labor regulations
- Executive orders promoting “Buy American”
- Public pressure on specific companies
Comparative Approaches
- Reagan: Market-oriented adjustment to manufacturing decline
- Clinton: NAFTA implementation, technology focus
- Bush: Limited manufacturing policy focus
- Obama: Targeted innovation and training programs
- Biden: Supply chain resilience, clean energy manufacturing
According to the Reshoring Initiative, the combination of reshoring and foreign direct investment in U.S. manufacturing created approximately 190,000 jobs from 2017-2019, an increase from the Obama years but representing a small fraction of overall manufacturing employment.
“Trump’s manufacturing policies represented a more interventionist approach than traditional Republican administrations, using tariffs and public pressure rather than just tax incentives to influence corporate decision-making on production location.”
The COVID-19 pandemic highlighted vulnerabilities in global supply chains, particularly for critical medical supplies and semiconductors. This has led to a bipartisan shift toward more active industrial policy, with the Biden administration continuing and expanding some of Trump’s focus on domestic production through the CHIPS Act and infrastructure investments.
Key Insight: While Trump’s manufacturing policies marked a departure from previous Republican administrations, the actual reshoring results were modest compared to the rhetoric, with manufacturing employment remaining well below pre-2000 levels.
Deregulation and Business Environment
Regulatory policy represents a key area where presidential administrations can significantly impact economic activity without congressional approval. The Trump administration pursued an aggressive deregulatory agenda across multiple sectors.
Scale and Scope of Deregulation
According to the Office of Management and Budget, the Trump administration eliminated or significantly modified approximately 1,000 regulations during its four-year term. The administration also implemented a “one-in, two-out” rule for new regulations, requiring agencies to eliminate two existing regulations for each new one created.
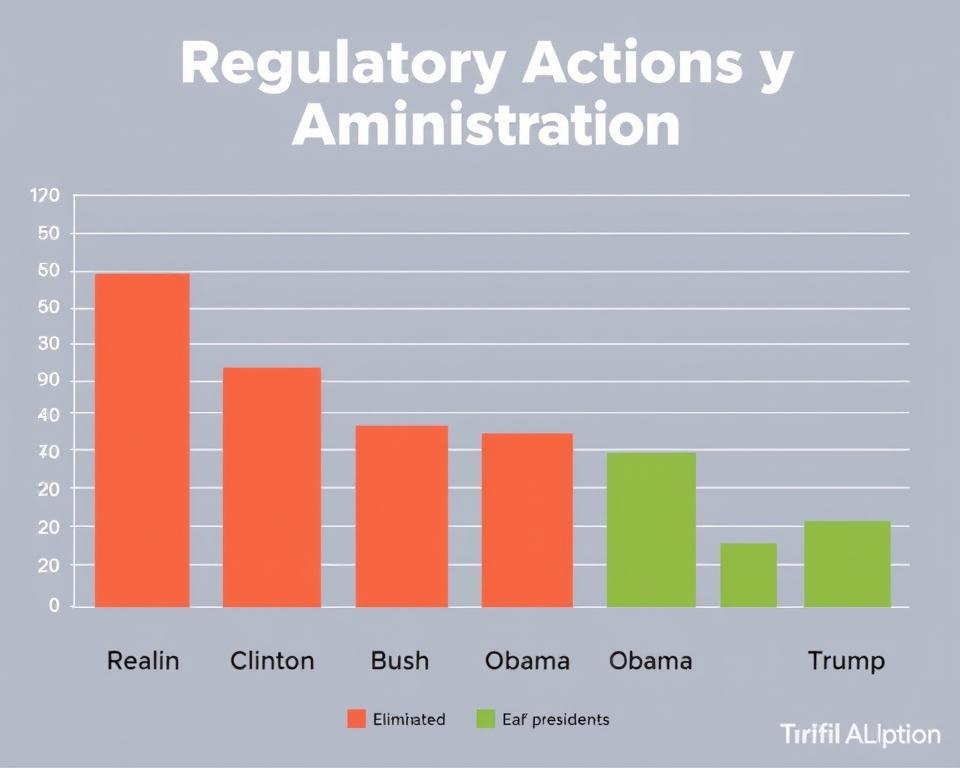
Regulatory actions across presidential administrations
This approach contrasted sharply with the Obama administration, which implemented significant new regulations in healthcare, financial services, and environmental protection. The Reagan administration also pursued deregulation, particularly in transportation and telecommunications, while the Clinton administration took a more balanced approach.
| Regulatory Area | Trump Approach | Obama Approach | Reagan Approach |
| Environmental | Significant rollbacks of Clean Power Plan, methane rules, fuel efficiency standards | Expanded regulations on emissions, water protection, fuel efficiency | Reduced EPA budget and enforcement |
| Financial | Eased Dodd-Frank requirements, reduced bank stress tests | Implemented Dodd-Frank, created CFPB | Deregulated savings and loan industry |
| Labor | Reversed overtime rules, reduced workplace safety reporting | Expanded overtime eligibility, increased worker protections | Reduced labor enforcement, opposed union power |
| Healthcare | Reduced ACA enforcement, expanded alternative plans | Implemented ACA, expanded healthcare regulations | Limited healthcare regulatory focus |
Economic Impact of Deregulation
The Council of Economic Advisers under Trump estimated that deregulatory actions would increase real incomes by $3,100 per household annually. Independent analyses from the Congressional Research Service found more modest impacts, noting that regulatory costs represent a small portion of overall business expenses for most industries.
Environmental deregulation, particularly in the energy sector, contributed to increased oil and gas production during Trump’s term. U.S. crude oil production increased from approximately 9 million barrels per day in January 2017 to 13 million by December 2019, according to the Energy Information Administration.
“While the Trump administration’s deregulatory agenda was more aggressive than previous Republican administrations in terms of pace and scope, many deregulatory actions faced legal challenges, limiting their immediate economic impact.”
The Biden administration has reversed many Trump-era deregulatory actions, particularly in environmental policy, highlighting the volatility that can occur when regulatory changes are implemented through executive action rather than legislation.
Key Data Point: According to the Office of Information and Regulatory Affairs, the Trump administration’s regulatory actions resulted in approximately $50 billion in reduced regulatory costs to businesses, though many of these changes have since been reversed.
Infrastructure and Public Investment
“Infrastructure week” became a recurring theme during the Trump administration, though comprehensive infrastructure legislation never materialized. This section compares Trump’s infrastructure approach with those of other administrations.
Infrastructure Proposals and Implementation
The Trump administration proposed a $1.5 trillion infrastructure plan in 2018 that relied heavily on state, local, and private investment, with $200 billion in federal funding. This plan did not advance in Congress, and infrastructure spending remained largely at pre-existing levels throughout Trump’s term.
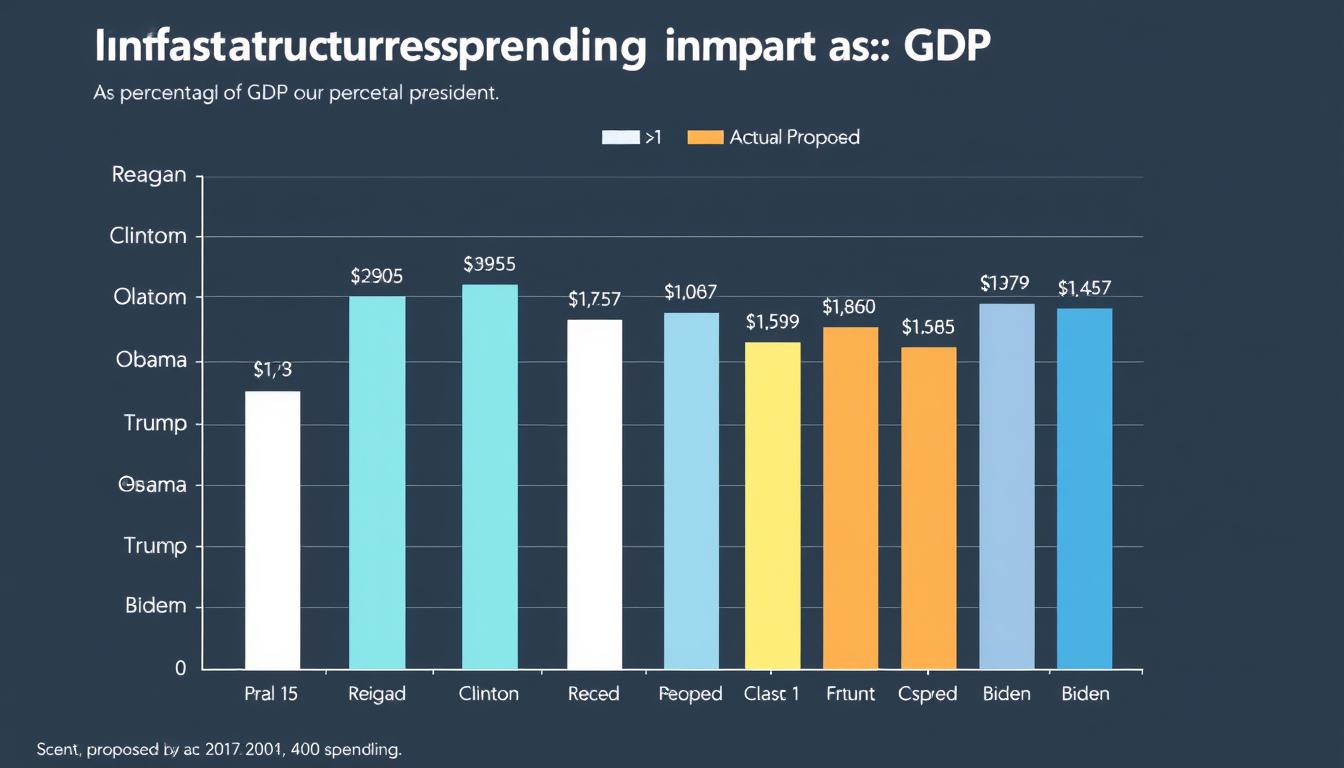
Infrastructure spending and proposals across presidential administrations
This approach contrasted with Obama’s American Recovery and Reinvestment Act, which included approximately $105 billion for infrastructure projects as part of economic stimulus. It also differed from Biden’s Infrastructure Investment and Jobs Act, which allocated $1.2 trillion for infrastructure with significant federal funding.
| Infrastructure Element | Trump Approach | Obama Approach | Biden Approach |
| Funding Model | Limited federal funding, emphasis on private investment | Direct federal spending through stimulus | Significant federal funding with state matching |
| Transportation Focus | Roads, bridges, airports | Roads, rail, public transit | Roads, rail, EV infrastructure |
| Environmental Integration | Limited environmental considerations, streamlined reviews | Green energy components | Climate resilience, clean energy focus |
| Implementation Success | Limited new initiatives enacted | Moderate implementation through ARRA | Major legislation passed, implementation ongoing |
Regulatory Streamlining for Infrastructure
While major infrastructure legislation did not pass during Trump’s term, the administration did implement regulatory changes aimed at accelerating infrastructure projects, including:
- Executive Order 13807 establishing “One Federal Decision” for major infrastructure projects
- Streamlined environmental review processes
- Reduced permitting timelines for energy infrastructure
- Expedited approvals for specific high-profile projects
According to the Council on Environmental Quality, these changes reduced average environmental impact statement completion time from 4.5 years to approximately 2.5 years for affected projects.
“The Trump administration’s infrastructure approach emphasized regulatory streamlining over direct federal investment, reflecting a preference for private sector leadership in infrastructure development that differed from both Obama’s stimulus approach and Biden’s more traditional public works model.”
The American Society of Civil Engineers’ Infrastructure Report Card gave U.S. infrastructure a grade of D+ in both 2017 and 2021, indicating limited progress in addressing infrastructure needs during Trump’s term.
Key Data Point: According to the Congressional Budget Office, federal infrastructure spending remained relatively stable at approximately 2.3% of GDP throughout Trump’s term, comparable to levels under Obama and below historical averages from the 1960s and 1970s.
Financial Markets and Investor Confidence
Stock market performance and business investment levels provide important metrics for evaluating economic policies. The Trump administration frequently cited market performance as evidence of economic success.
Stock Market Performance
During Trump’s presidency, the S&P 500 increased by approximately 67% from inauguration to the end of his term, including the pandemic-induced crash and recovery. This represented an annualized return of approximately 14%, compared to 13.8% during Obama’s second term and 16.5% during Clinton’s second term.
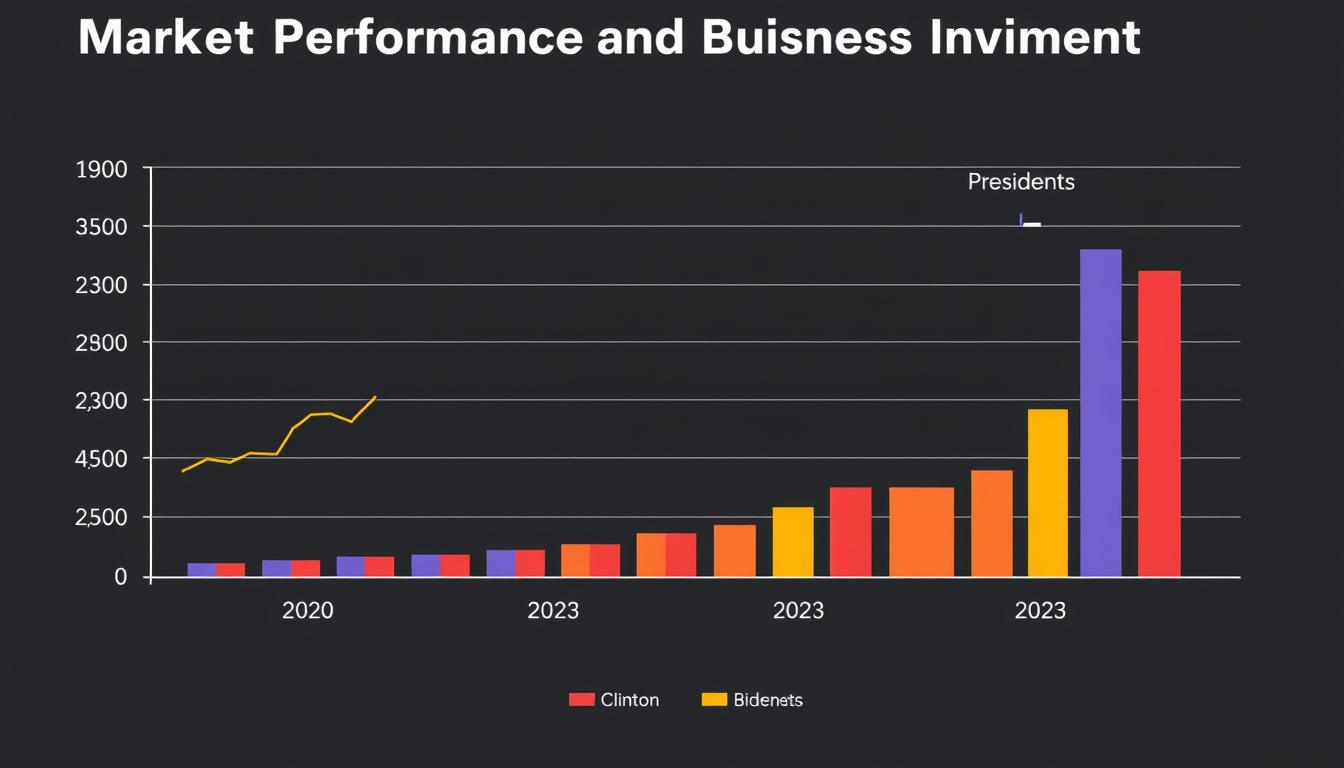
Stock market performance and business investment across administrations
Market volatility, as measured by the VIX index, was higher during Trump’s term compared to Obama’s second term, with significant spikes during trade tensions with China and the COVID-19 pandemic. This volatility reflected both policy uncertainty and external economic shocks.
Business Investment and Confidence
Business fixed investment as a percentage of GDP increased from 17.7% in Q4 2016 to 18.2% by Q4 2019, according to the Bureau of Economic Analysis. This modest increase followed the implementation of corporate tax cuts and deregulatory policies.
Trump Financial Market Impact
- Corporate tax cuts boosted profits and buybacks
- Deregulation improved financial sector sentiment
- Trade policy uncertainty created periodic volatility
- Federal Reserve independence questioned
- Pandemic response stabilized markets in 2020
Comparative Approaches
- Reagan: Deregulation, tax cuts, Fed support
- Clinton: Balanced budget focus, tech boom
- Bush: Tax cuts, post-9/11 and 2008 crisis response
- Obama: Post-crisis financial regulation, steady growth
- Biden: Pandemic recovery, inflation concerns
According to Federal Reserve data, corporate profits after tax increased by approximately 16% from 2017 to 2019, driven in part by the reduction in corporate tax rates. A significant portion of these profits went to share buybacks, which reached a record $806 billion in 2018 according to S&P Dow Jones Indices.
“While the Trump administration’s policies were generally favorable for financial markets, particularly through corporate tax cuts and deregulation, the benefits were unevenly distributed, with shareholders seeing greater gains than workers through wages.”
The Federal Reserve’s independence became a point of contention during Trump’s term, with the president frequently criticizing interest rate increases. This represented a departure from the traditional separation between the White House and monetary policy that had been maintained by previous administrations.
Key Insight: While stock markets performed well during most of Trump’s term, business investment growth was more modest than anticipated following the tax cuts, suggesting that improved market performance was driven more by increased profits and buybacks than by expanded productive capacity.
Resilience to Economic Shocks
A president’s economic legacy is often defined by their response to unexpected economic crises. The COVID-19 pandemic presented an unprecedented economic shock during Trump’s final year in office.
COVID-19 Economic Response
The pandemic triggered the sharpest economic contraction since the Great Depression, with GDP falling by 31.2% (annualized) in Q2 2020. The Trump administration’s response included:
- The $2.2 trillion CARES Act providing direct payments, enhanced unemployment benefits, and business support
- Federal Reserve coordination on monetary policy and emergency lending facilities
- Regulatory relief for affected businesses and financial institutions
- Operation Warp Speed to accelerate vaccine development
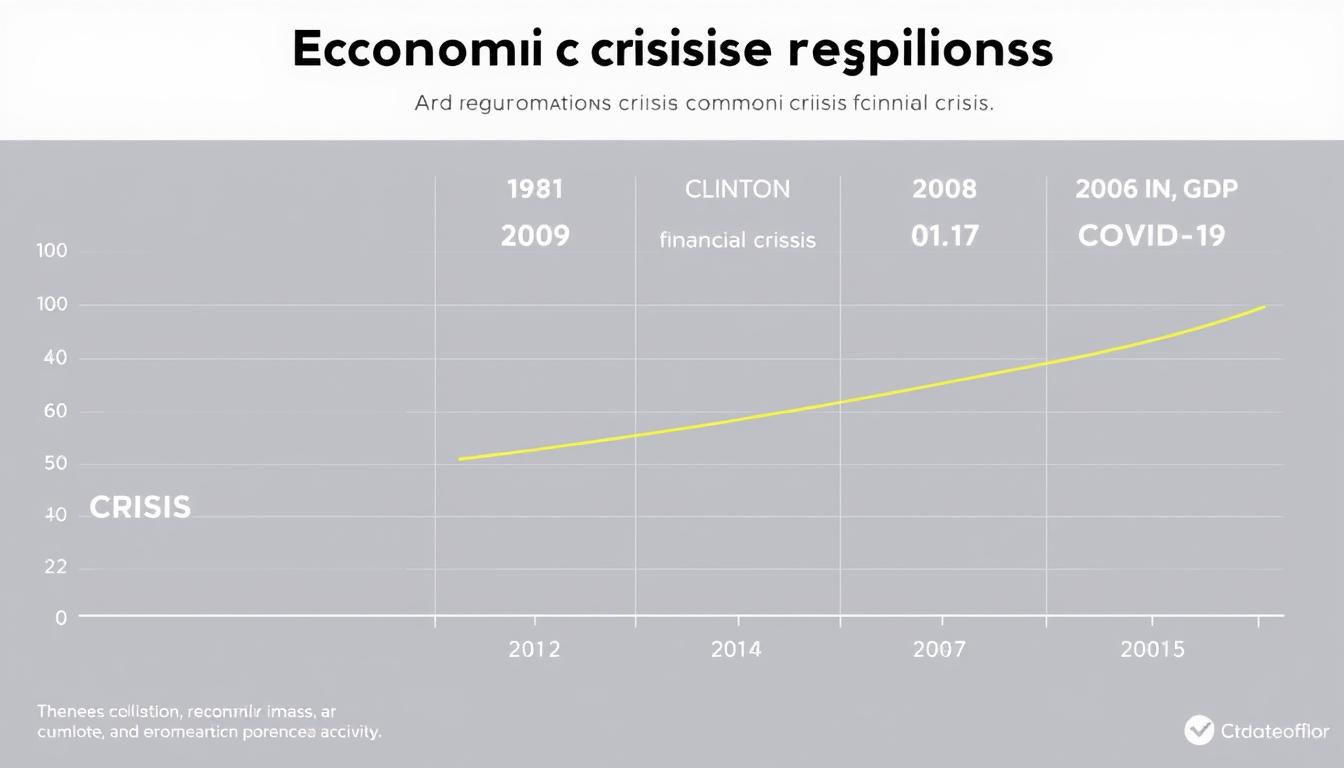
Economic crisis responses across presidential administrations
This response can be compared to the Obama administration’s handling of the 2008-2009 financial crisis through the American Recovery and Reinvestment Act ($831 billion) and financial sector interventions. Bush faced both the post-9/11 economic disruption and the beginning of the 2008 crisis, while Reagan confronted stagflation early in his term.
| Crisis Response Element | Trump (COVID-19) | Obama (2008 Crisis) | Bush (2008 Crisis) |
| Fiscal Response Size | $2.2 trillion (CARES Act) + additional measures (10.5% of GDP) | $831 billion (ARRA) (5.7% of GDP) | $700 billion (TARP) (4.8% of GDP) |
| Direct Household Support | $1,200 direct payments, $600/week enhanced unemployment | Tax credits, unemployment extension | $600 tax rebates |
| Business Support | Paycheck Protection Program, industry-specific aid | Auto industry rescue, small business lending | Financial sector stabilization |
| Employment Impact | 22 million jobs lost, partial recovery by term end | 8.7 million jobs lost, gradual recovery | Initial 2 million jobs lost |
Recovery Trajectory
The economic recovery from COVID-19 began rapidly, with GDP growing by 33.8% (annualized) in Q3 2020. By the end of Trump’s term, approximately 12.5 million of the 22 million jobs lost had been recovered, according to the Bureau of Labor Statistics.
This recovery pattern differed from the slower but steadier recovery from the 2008-2009 financial crisis under Obama, reflecting both the different nature of the economic shocks and the more aggressive fiscal and monetary response to COVID-19.
“The Trump administration’s COVID-19 economic response represented one of the largest peacetime fiscal interventions in U.S. history, reflecting a bipartisan recognition of the unprecedented nature of the pandemic-induced economic shock.”
The pandemic response increased the federal deficit to 14.9% of GDP in fiscal year 2020, the highest since World War II. This fiscal expansion represented a departure from traditional Republican fiscal conservatism but aligned with emergency measures taken by both parties during major economic crises.
Key Data Point: According to the Congressional Budget Office, the CARES Act and subsequent COVID-19 relief measures prevented a much deeper economic contraction, potentially saving millions of jobs despite the unprecedented nature of the pandemic shock.
Conclusion: Assessing Economic Transformation
After examining Trump’s economic policies across multiple dimensions and comparing them with those of other administrations, several conclusions emerge about the relative impact and transformative nature of his economic approach.
Areas of Significant Change
The Trump administration’s most transformative economic impacts came in three primary areas:
- Trade Policy: Trump’s rejection of multilateral trade agreements and aggressive use of tariffs represented the most significant shift in U.S. trade policy since the early post-WWII period, breaking with decades of bipartisan consensus on trade liberalization.
- Regulatory Approach: The administration’s systematic deregulatory agenda across multiple sectors, while facing legal challenges, represented a more comprehensive approach to reducing regulatory burdens than previous Republican administrations.
- Tax Structure: The 2017 Tax Cuts and Jobs Act implemented the largest corporate tax reduction in U.S. history, significantly altering business taxation while creating a complex set of temporary individual tax provisions.
Areas of Continuity
In other economic domains, Trump’s policies represented more evolutionary than revolutionary change:
- Employment growth continued trends from the Obama recovery
- Manufacturing revival showed modest gains despite rhetoric
- Infrastructure investment remained at similar levels to previous administrations
- Federal Reserve independence was challenged rhetorically but maintained institutionally
Comparative impact assessment of economic policies across administrations
The COVID-19 pandemic response, while unprecedented in scale, reflected a largely bipartisan approach to crisis management rather than a distinctively Trump-oriented economic philosophy. The CARES Act passed with overwhelming support from both parties, suggesting its approach transcended partisan economic thinking.
“Trump’s economic legacy is defined by a hybrid approach that combined traditional Republican tax and regulatory policies with a more nationalist, interventionist approach to trade and industrial policy—creating a distinctive economic framework that neither fully aligned with conservative orthodoxy nor embraced progressive alternatives.”
When compared to transformative economic shifts like Reagan’s supply-side revolution, Roosevelt’s New Deal, or Johnson’s Great Society, Trump’s economic impact appears more targeted than comprehensive. His most enduring economic legacy may be the legitimization of a more nationalist, protectionist approach to trade and industrial policy within the Republican party, rather than fundamental restructuring of the American economy.
The Biden administration’s continuation of some Trump-era trade policies, particularly regarding China, suggests that this shift may represent a more lasting change in American economic thinking than the tax cuts or deregulatory efforts that have proven more vulnerable to reversal.
Final Assessment: While Trump implemented significant economic policy changes, particularly in trade and corporate taxation, the fundamental structure of the American economy—its labor markets, social safety net, monetary policy framework, and global economic integration—remains largely intact, suggesting evolutionary rather than revolutionary economic transformation.
