Why does the U.S. spend nearly twice as much on medical care per person compared to other wealthy nations—yet still lags in life expectancy? The answer lies in how different countries structure their health care systems. While Americans pay $12,742 annually per capita, nations like Canada and Germany average just $6,850, according to OECD 2024 data.
Administrative costs tell part of the story. The U.S. spends over $1,000 per person on paperwork—five times more than countries with simpler systems. Despite similar hospital visits and doctor consultations, pricing disparities create stark contrasts in accessibility and coverage.
Four primary models dominate globally: single-payer (Canada), social insurance (Germany), hybrid (France), and private-market (U.S.). Each approach impacts outcomes, from wait times to preventive care rates. Understanding these differences helps explain why some populations stay healthier while spending less.
Key Takeaways
- The U.S. spends significantly more per person than other developed nations.
- Administrative costs in America are five times higher than in many countries.
- Four main health care models shape coverage and outcomes globally.
- Price differences—not usage—drive spending gaps between nations.
- Funding structures directly affect life expectancy and preventive care access.
Introduction: Understanding Global Health Insurance Differences
Infant mortality rates reveal stark contrasts: 5.4 deaths per 1,000 in the united states versus 3.8 in peer nations, per OECD 2024 data. This gap underscores how public health priorities diverge globally. While most wealthy countries treat medical care as a right, the U.S. hybrid model leaves millions unprotected.
Universal coverage systems—like Canada’s single-payer or Germany’s social insurance—ensure under 2% uninsured rates. Meanwhile, 40 million Americans lack coverage entirely. The Rekindling Reform initiative identifies this as a moral failing, citing debates over equity and cost.
Unique to the U.S. is financial toxicity—where patients skip care due to bills. No other developed health system burdens households this way. Key metrics ahead will explore spending, coverage models, and strategies to contain costs.
1. Health Spending Per Capita: A Cross-Country Comparison
Medical expenses differ drastically worldwide, with the united states leading in per-person health care costs. In 2024, Americans spent $12,742 annually on health—nearly double the OECD average. This gap stems from pricing methods, not usage, as hospital visits and prescriptions cost significantly more, highlighting the challenges within the national health system.
United States: The Highest Spender
The U.S. allocates 17.8% of GDP to health care, far exceeding the 11% OECD norm. Administrative inefficiencies in the national health system add $1,000 per person in paperwork alone. A 2020 study showed findings that medical prices grew 14% versus general inflation, widening the affordability gap in health coverage.
Canada, France, and Germany: Balancing Costs and Coverage
These nations achieve universal coverage while spending less. Key differences:
- Canada: Provinces fund 70% via taxes; per-capita costs hover near $6,500.
- France: 70% public funding keeps out-of-pocket expenses low.
- Germany: Statutory insurance covers 85% of residents at $7,000 per capita.
United Kingdom: Budget Constraints and Public Health
The UK’s NHS operates on £3,405 per person (2022), relying on strict budget caps. Despite lower spending on public health services, it delivers comparable outcomes through centralized negotiations and preventive care prioritization measures within the health system for patients.
CountrySpending Per Capita (USD)
| % GDP | Primary Funding Source | ||
|---|---|---|---|
| United States | $12,742 | 17.8% | Private/Employer |
| Germany | $7,000 | 11.7% | Statutory Insurance |
| Canada | $6,500 | 10.8% | Tax Revenue |
| UK | $4,500 | 10.2% | Tax Revenue |
While spending reflects priorities, outcomes depend on system efficiency. The U.S. faces unique challenges in aligning costs with results.
2. Coverage Models: Who Gets Insured?
Nations adopt distinct approaches to ensure citizens receive necessary care. While some prioritize universal health coverage, others rely on fragmented systems. These differences shape accessibility and affordability.

Universal Systems: Canada, France, Germany, and the UK
These countries guarantee care for all residents through varied structures:
- Canada: The Canada Health Act mandates 100% provincial coverage for hospital and physician services. Taxes fund 70% of costs.
- Germany: Citizens enroll in one of 110 nonprofit sickness funds. Mandatory payroll deductions ensure 85% receive statutory insurance.
- France: Supplementary plans cover 95% of dental and vision costs, bridging gaps in public health offerings.
- UK: The NHS funds care for 100% of residents via general taxation, eliminating out-of-pocket fees for most services.
The U.S. Model: Employer-Based and Gaps
In the united states, 49% rely on employer-sponsored plans, while Medicaid covers 20%. Despite ACA reforms, 8.6% remain uninsured—a stark contrast to peer nations and a challenge for the national health system in this country. The growth of alternative coverage options remains crucial to addressing these gaps.
Financial barriers persist. A 2023 study found 38% of Americans delayed care due to costs, a rarity in universal systems. “Employer ties create instability,” notes a Kaiser Family Foundation report.
3. Funding Health Insurance: Where Does the Money Come From?
Funding models shape who gets care and how much it costs. Nations rely on taxes, payroll deductions, or private payments to keep their health systems running. These sources directly impact affordability and coverage gaps.

Tax-Based Systems: UK and Canada
The UK funds 79% of care through general taxes. This centralized approach keeps administrative costs at just 2%. Canada’s provinces manage tax revenues, covering 70% of medical expenses.
Social Insurance Models: France and Germany
France’s CSG contribution takes 9.7% of income, while Germany splits 14.6% payroll taxes between employers and employees. Both systems ensure near-universal coverage with low out-of-pocket costs.
Mixed Funding in the U.S.: Private and Public
Private plans cover 34% of Americans, but administrative waste consumes 12% of spending. Public programs like Medicare fill gaps for 21% of the population. “Fragmentation drives up prices,” notes a Commonwealth Fund report.
| Country | Primary Funding Source | Admin Costs | Coverage Rate |
|---|---|---|---|
| UK | General Taxes | 2% | 100% |
| Germany | Payroll Taxes | 5% | 99% |
| U.S. | Private/Public Mix | 12% | 91% |
Pharmaceutical spending reveals another divide. The U.S. allocates 12% of its budget to drugs—50% more than the OECD average. These contrasts show how government choices shape outcomes.
4. How Does Health Insurance Vary Across Countries in Practice?
Access to medical services differs widely depending on where patients live. While some nations prioritize same-day primary care, others struggle with long wait times for specialists. These practical differences reveal how systems perform beyond funding models.
Access to Primary Care
In Canada, 59% of patients see a GP within a day, compared to 51% in the U.S. France’s médecin traitant system requires referrals, reducing unnecessary specialist visits. Meanwhile, 20% of uninsured Americans use emergency rooms for primary care—a costly workaround in the national health system.
Specialist Referrals and Wait Times
Germany’s self-referral rates hit 76%, bypassing gatekeepers. The UK aims for 18-week elective care waits but averages 21.6 weeks. Equipment disparities also matter: the U.S. has 40 MRI scanners per million people—four times the UK’s capacity.
| Country | Primary Care Access | Specialist Wait (Weeks) |
|---|---|---|
| Canada | 59% same/next-day | 10.2 |
| Germany | 76% self-referral | 4.3 |
| UK | 83% satisfaction | 21.6 |
“Gatekeeping works when paired with ample resources,” notes a 2024 Lancet study. These contrasts show how design choices impact real-world care.
5. Cost Containment Strategies
Controlling medical expenses remains a top priority for nations worldwide. While some countries enforce strict *policy* measures, others struggle with unchecked *growth*. These approaches directly impact affordability and system sustainability.
Price Controls in France and Germany
France’s ONDAM law caps annual spending *growth* at 2.3%, ensuring predictable budgets. Germany’s IQWiG evaluates drug *cost*-effectiveness, rejecting treatments exceeding €50,000 per quality-adjusted life year. “Transparent pricing prevents exploitation,” notes a Berlin health economist.
Budget Caps in the UK and Canada
The UK’s NICE uses a £20,000–30,000/QALY threshold to approve therapies. Canada’s PMPRB regulates patented drug *prices*, tying them to median international rates. Both systems prioritize value, but face criticism for delayed innovation.
The U.S. Challenge: Unmanaged Costs
Hospital *prices* vary by 300% for identical procedures, per 2024 data. Administrative waste consumes 15% of spending—triple Germany’s rate. Without centralized negotiation, *cost* containment remains elusive.
“The U.S. rewards volume over value,”
states a Johns Hopkins report.
| Country | Strategy | Outcome |
|---|---|---|
| France | Spending growth cap | 2.3% annual increase |
| Germany | Drug cost reviews | 85% approval rate |
| U.S. | Market-driven pricing | 17.8% GDP spent |
These contrasts underscore how *policy* choices shape financial burdens. Nations balancing *cost* and access offer lessons for struggling systems.
6. Role of Government in Health Insurance
Governments worldwide shape medical access through funding, regulation, and oversight within their health systems. Their involvement ranges from centralized control to decentralized management, directly influencing the affordability and quality of health care. These systems determine whether citizens face bureaucratic hurdles or seamless care.
Centralized vs. Decentralized Systems
The UK’s Department of Health oversees all programs, ensuring uniform standards in national health services. In contrast, the U.S. fragments authority across HHS, state agencies, and private insurers, complicating care measures. “Centralization reduces redundancy,” notes a Lancet report, citing Germany’s Federal Joint Committee, which streamlines 200 million coverage decisions annually, providing valuable findings for policymakers analyzing growth in healthcare systems.
Canada delegates formulary management to provinces, creating regional pricing differences. France’s Union Nationale des Caisses d’Assurance Maladie balances national goals with local flexibility. These approaches highlight how government structures impact efficiency.
Regulation of Private Insurance
Australia’s PHI rebate system encourages private plan uptake while capping profits. The U.S. ERISA law preempts state regulation, limiting consumer protections. “Hybrid models require strict oversight,” argues a Commonwealth Fund study, pointing to France’s 95% coverage rate despite private sector involvement.
| Country | Regulatory Body | Key Policy |
|---|---|---|
| Germany | Federal Joint Committee | Standardized benefits |
| U.S. | HHS/State Agencies | ERISA preemption |
| France | UNCAM | Mandatory supplementary plans |
Effective health policy balances innovation with equity. Nations like Germany prove tight regulation needn’t stifle competition, while U.S. fragmentation often raises costs without improving outcomes.
7. Provider Payment Structures
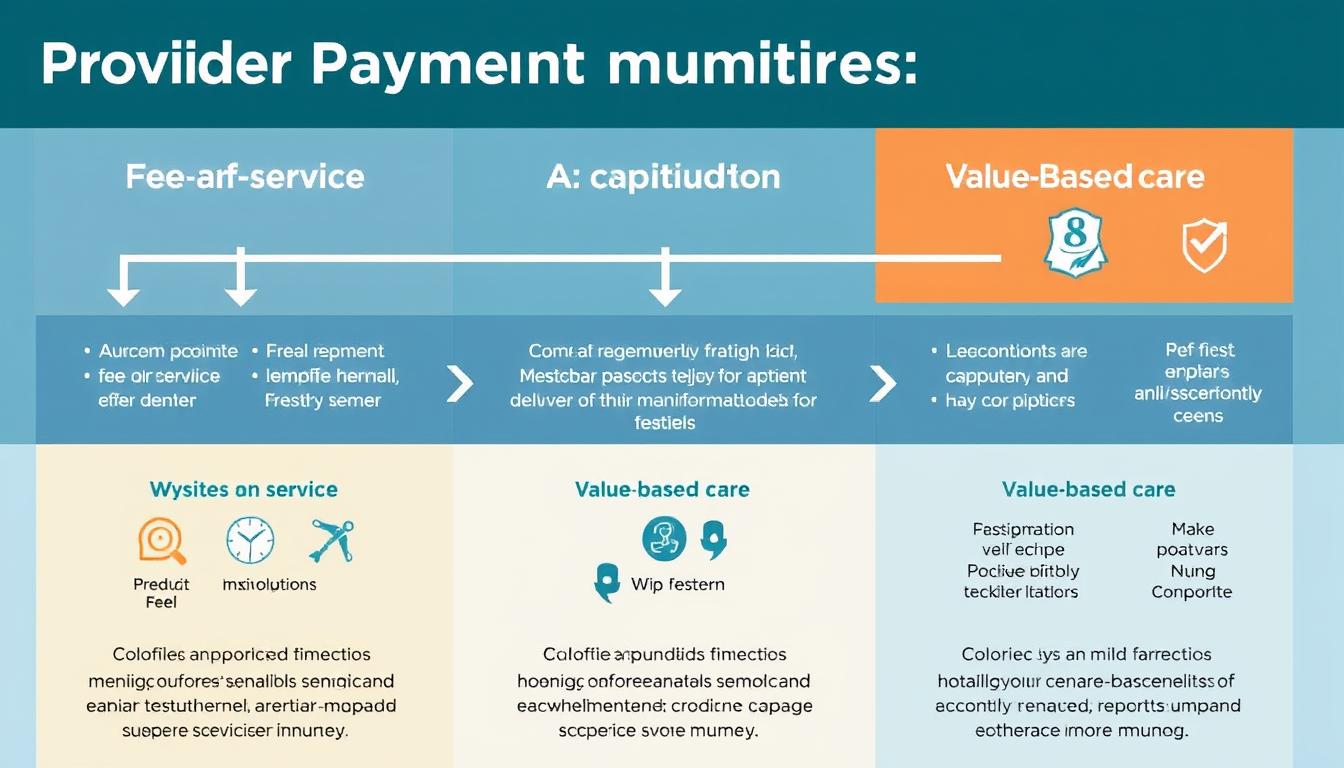
Payment structures shape how medical professionals deliver care globally in various health systems. Some countries prioritize fixed salaries as a government measure, while others reward volume through fee-for-service models. These approaches directly impact costs and patient access to services across the world.
Fee-for-Service vs. Salary Models
In the U.S., physicians earn $260,000 on average—triple UK GP salaries (£68,000–£103,000). This gap reflects fee-for-service incentives, where more procedures mean higher pay. Conversely, Canada’s provincial negotiations set fixed rates every three years, prioritizing stability over volume. This example highlights the differences in national health systems and the implications for health policy and methods used by policymakers at various levels.
France’s T2A system bundles payments for hospital treatments, reducing unnecessary tests. Germany’s EBM point-value schedule standardizes fees for 2,300 services, ensuring transparency. “Salaries curb over-treatment but may limit flexibility,” notes a 2024 OECD report.
Negotiations Between Payers and Providers
U.S. Medicare pays $3,500 for hip replacements—triple France’s $1,200 rate. This disparity stems from fragmented negotiations. Surprise billing laws now curb out-of-network charges, but care costs remain unpredictable.
- UK: Centralized NHS budgets cap specialist earnings.
- Germany: Sickness funds collectively bargain with provider associations.
- Canada: Provinces face strikes when fee talks stall.
These contrasts show how payment designs shape affordability. Nations balancing incentives and equity achieve better outcomes at lower costs.
8. Integration of Health Services
Coordinating medical services efficiently remains a challenge in many nations and is a critical aspect of public health. Well-connected health systems reduce duplicate tests and improve outcomes for chronic health conditions. The UK and Germany lead in care coordination, while the U.S. struggles with fragmentation, reflecting the varying levels of health care growth across different countries.
UK’s Approach: Unified Care Networks
Since 2022, England’s NHS integrated care systems serve 42 regions. This health system demonstrates how primary care trusts work with hospitals to streamline referrals as an example of effective measures. This model cuts wait times by 18% compared to decentralized approaches, showcasing the benefits of coordinated care over the years.
Key features include:
- Single electronic health records across providers
- Preventive care teams visiting high-risk patients
- Budget pooling for entire patient pathways
U.S. Fragmentation and Partial Solutions
Accountable Care Organizations (ACOs) cover 35 million Americans but lack NHS-style integration in the health system. Kaiser Permanente shows success with its closed system, serving 12.6 million members with coordinated health services as an example of effective measures in the country.
Challenges persist:
- 36% of patients experience lost medical records
- Specialists rarely share EHR systems with primary doctors
- Payment models discourage care coordination
| Country | Integration Model | Covered Population |
|---|---|---|
| UK | Primary Care Trusts | 100% NHS patients |
| Germany | Disease Management Programs | 8 million chronic patients |
| U.S. | ACOs/Kaiser Model | 35 million/12.6 million |
France’s regional hospital agencies (ARHs) demonstrate another approach. They align budgets with local needs while maintaining national standards. “Integration works when incentives align,” notes a 2024 Commonwealth Fund analysis.
9. Market Forces in Health Insurance
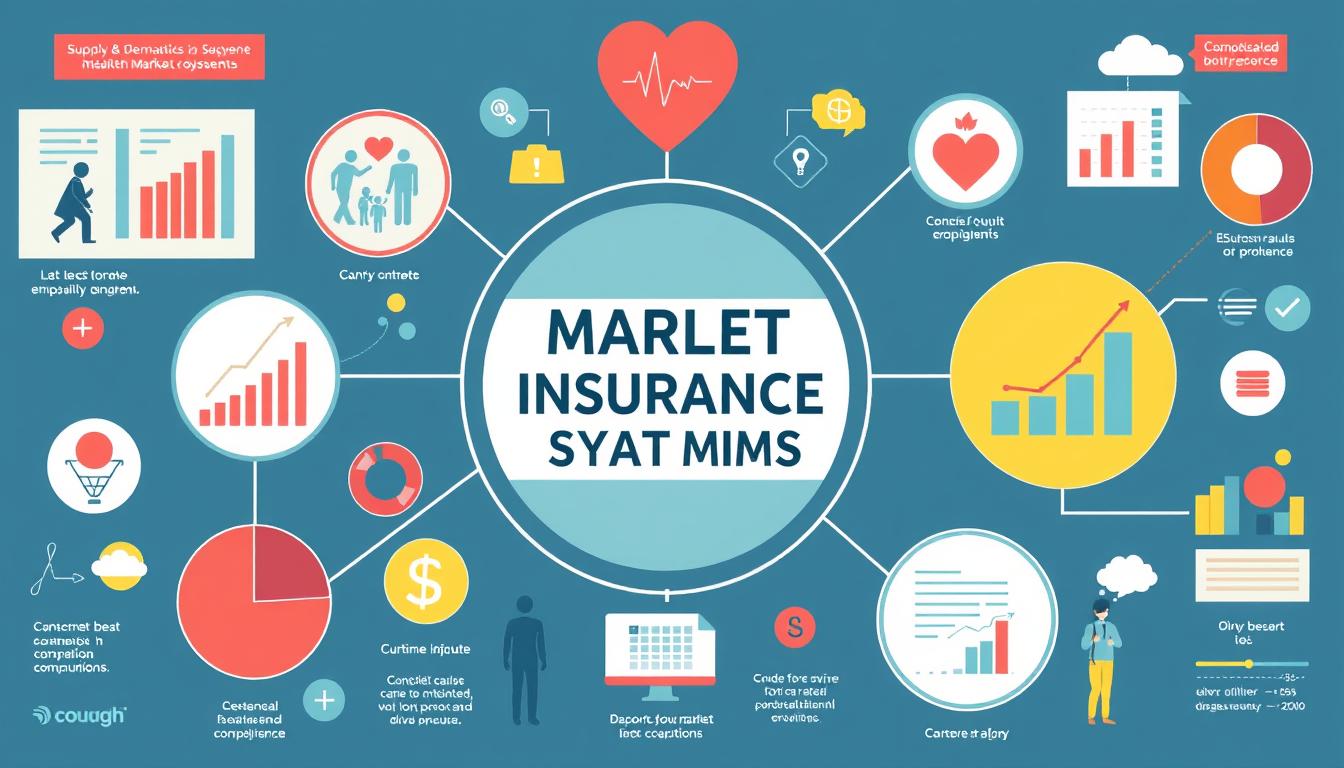
Germany’s risk-adjustment pool redistributes €25B annually among insurers. This financial balancing act enables competition while ensuring stability in public health and health care. Most nations blend market mechanisms with regulation, but approaches vary significantly, impacting growth and care measures.
Competition in Germany’s Sickness Funds
Germany’s 110 nonprofit insurers compete on service quality, not price. Members can switch funds annually, yet only 1.1% do. The system prevents risk selection through mandatory participation and standardized benefits.
Key features driving efficiency:
- Risk-adjusted payments compensate funds for sicker enrollees
- Uniform contribution rates (14.6% of income)
- Performance bonuses for preventive programs
Limited Market Role in Canada and the UK
Canada prohibits private coverage for medically necessary care, creating a single-payer monopoly. The UK allows parallel private insurance, but only 10% purchase it—mostly for faster specialist access.
Notable restrictions:
- Canadian provinces ban duplicate coverage for hospital/physician services
- UK private hospitals cannot poach NHS staff during shortages
- Both systems cap private sector growth to protect public funding
| Country | Private Market Share | Annual Switching Rate | Key Regulation |
|---|---|---|---|
| Germany | 15% (supplementary) | 1.1% | Risk adjustment pool |
| Canada | 0% (core services) | N/A | Canada Health Act |
| UK | 10% (parallel) | N/A | NHS priority rules |
The Swiss model offers an alternative approach. Mandatory basic insurance covers all residents through competing private insurers. This demonstrates how market forces can coexist with universal coverage when properly structured.
10. Health Outcomes: Does Spending Translate to Quality?
Higher spending doesn’t always guarantee better results in global health systems. The U.S. invests nearly double peer nations’ budgets yet trails in life expectancy and preventable deaths. This spending-quality gap highlights how structural choices in health policy impact population wellbeing beyond financial inputs, emphasizing the need for effective public health measures and analysis of growth in health care.
Life Expectancy and Mortality Rates
American life expectancy averages 76.4 years—three years below Germany’s 79.7. Maternal mortality shows even starker contrasts: 23.8 deaths per 100,000 live births versus France’s 8.7. These disparities persist despite the U.S. spending 17.8% of GDP on medical care.
Amenable mortality rates—deaths preventable through timely treatment—reveal system effectiveness. The U.S. records 112 such deaths per 100,000 population, nearly double France’s 64. Chronic disease management explains part of this gap.
Preventive Care and Disease Control
Only 50% of U.S. diabetes patients achieve blood sugar control, compared to 66% in Germany. Cancer screening rates also lag—68% of eligible Americans get tested versus 75% in the UK. These preventive gaps contribute to higher complication rates.
| Country | Preventable Hospitalizations (per 100k) | Cardiovascular DALYs* |
|---|---|---|
| United States | 2,340 | 3,210 |
| Germany | 1,180 | 2,450 |
| France | 980 | 2,310 |
*Disability-Adjusted Life Years per 100,000 population
The UK’s focus on primary care access yields better chronic disease outcomes at lower costs. Its system demonstrates that quality depends more on care coordination than spending levels alone.
11. Public Satisfaction with Health Systems
Public approval ratings reveal striking differences in how countries view their health systems. While spending and coverage dominate health policy debates, citizen contentment often reflects hidden strengths and weaknesses in health care. The Commonwealth Fund’s 2024 survey shows 75% of Germans praise their health framework—far above America’s 43% satisfaction rate.
High Approval in France and Germany
France’s 93% approval persists despite €20 GP copays, proving cost-sharing needn’t undermine trust. Key drivers include:
- Same-day care access for 82% of patients
- Transparent prescription drug pricing
- Mandatory supplementary coverage gaps
Germany’s statutory insurance earns praise for specialist access—76% self-referral rates versus U.S. gatekeeping. “Patients value choice without financial surprises,” notes a Berlin policy analyst.
Wait Time Criticisms in Canada and the UK
Canada’s 27-week median specialist waits fuel frustration despite universal access. The UK NHS faces similar challenges:
| Service | Canada Wait (Weeks) | UK Wait (Weeks) |
|---|---|---|
| Hip Replacement | 38 | 24 |
| MRI Scan | 12 | 18 |
Both nations maintain 85%+ system support by prioritizing emergency care. Contrast this with U.S. emergency visits—18% involve surprise billing, creating lasting dissatisfaction.
“Satisfaction reflects expectations as much as outcomes,”
concludes a 2024 Lancet study. While Germans accept 14.6% payroll deductions for guaranteed care, Americans resent $1,250 average out-of-pocket costs for patchy coverage.
12. Technological Adoption and Innovation

Digital transformation is reshaping medical systems worldwide at different speeds. While the U.S. leads in research spending, European nations often implement solutions more efficiently. These contrasts reveal how funding priorities and regulatory frameworks impact real-world care delivery.
Electronic Health Records in the U.S.
America invests heavily in health care tech, spending triple the EU’s R&D budget. Nearly 80% of U.S. providers use telemedicine—almost double Europe’s 45% rate. However, fragmented EHR systems create interoperability challenges across hospitals and clinics, impacting health care delivery levels.
Key issues include:
- $15 billion annual costs for maintaining multiple platforms
- 40% of physicians report decreased productivity during transitions
- Limited data sharing between competing hospital networks
Cost-Effectiveness in European Systems
Germany’s DiGA program fast-tracks digital health apps within three months of application. The UK’s Genomic Medicine Service sequences 100,000 genomes annually at 40% lower costs than U.S. labs. France evaluates 3D mammography coverage through strict cost-benefit analyses.
Notable European innovations:
- AI diagnostic reimbursement policies tied to outcome improvements
- Centralized procurement reducing scanner costs by 30-50%
- Cross-border services like Estonia’s e-prescription system
| Technology | U.S. Adoption | EU Adoption | Cost Difference |
|---|---|---|---|
| Telemedicine | 80% | 45% | +120% |
| AI Diagnostics | 22% | 18% | +65% |
| Genomic Testing | 12% | 9% | +40% |
These patterns show how policy choices shape innovation trajectories. While America drives breakthroughs, European programs often deliver broader access at sustainable costs.
13. Challenges in U.S. Health Insurance Reform
Reforming America’s medical coverage faces unique hurdles compared to global peers and other countries. Unlike single-payer nations, the united states grapples with political divides and administrative bloat that inflate costs without improving health care. These structural issues make meaningful change difficult despite widespread recognition of efforts and findings pointing to problems.
Political Barriers to Universal Coverage
Fifty states still reject Medicaid expansion, leaving 2.2 million low-income residents uninsured. The employer-sponsored system enjoys $350 billion in annual tax breaks—a subsidy rarely questioned in Congress. “Special interests profit from complexity,” notes a Brookings report, highlighting how lobbyists block streamlined alternatives.
Administrative Waste and Complexity
Billing paperwork consumes $496 billion yearly—enough to cover all uninsured Americans twice over. Narrow networks limit choices in 42% of marketplace plans, while prior authorization denials hit 8% for commercial coverage versus 4% in Medicare. Hospital consolidation worsens access to care, with 90% of markets now highly concentrated, reflecting the government’s struggle to balance health system measures across different levels of health care in various countries.
Key pain points include:
- Duplicate tests from unconnected EHR systems
- Varying formularies across 900 private insurers
- No centralized pricing for common procedures
These inefficiencies drive up costs without enhancing quality. Until health policy addresses these root causes, the united states will keep spending more for less.
14. Lessons from Abroad for the U.S. System
Many nations have found effective ways to deliver quality care while controlling costs. The U.S. could learn from these approaches to improve its own health systems. Several countries offer proven strategies that balance accessibility, affordability, and efficiency.
Successful Models Worth Considering
Germany’s reference pricing keeps drug costs manageable. The government sets maximum prices based on therapeutic value. This approach has reduced spending on medications by 22% since 2010.
France uses global hospital budgets to prevent overspending. Each facility receives a fixed annual amount for operations, which is one of the effective methods that countries implement to encourage efficiency in health care without sacrificing quality. This approach is part of broader efforts to optimize resources and improve the growth of health systems.
Other effective policies include:
- UK’s NICE evaluations for cost-effective treatments
- Canada’s bulk purchasing of generic drugs
- Switzerland’s enforced individual mandate
Adapting Foreign Solutions to America
Australia’s hybrid model shows promise for the U.S. It combines public coverage with private options. This system achieves 90% coverage while spending just 9.5% of GDP.
Key considerations for policy transfer:
- Cultural acceptance of government involvement
- Existing infrastructure limitations
- Political feasibility of changes
A recent study highlights Sweden’s success with equitable access. Their approach demonstrates how public funding can achieve better outcomes at lower costs.
While no system is perfect, these international examples provide valuable lessons. Thoughtful adaptation could help the U.S. address its healthcare challenges.
15. Future Trends in Global Health Insurance

Medical systems worldwide face evolving challenges and opportunities. As demographics shift and technology advances, countries must adapt their approaches to maintain quality health care while managing costs. The OECD projects health spending will reach 14% of GDP by 2040 due to these pressures, highlighting the need for effective measures and sources of growth in the health system.
Demographic Shifts Driving Change
Aging populations are reshaping medical needs globally. Japan leads with 29% of citizens over 65, pioneering community-based care models. Germany reformed its long-term insurance system in 2023, adding respite benefits for family caregivers.
Key developments include:
- UK’s NHS Workforce Strategy 2024 targeting 50,000 new nurses
- U.S. Medicare Advantage enrollment hitting 50% of eligible seniors
- EU cross-border directives easing access to specialized services
Technology Transforming Delivery
Telemedicine usage tripled since 2020, with 65% of U.S. providers now offering virtual visits. The EU Digital Health Package standardizes e-prescriptions across 22 nations, reducing duplicate testing.
| Trend | Leading Region | Adoption Rate |
|---|---|---|
| AI Diagnostics | North America | 42% |
| Remote Monitoring | Scandinavia | 58% |
| Blockchain Records | Asia-Pacific | 31% |
These innovations promise better access but require careful cost management. “Sustainable growth depends on balancing tech investments with core care needs,” notes a 2024 WHO report.
Conclusion: Key Takeaways on Health Insurance Variations
Global comparisons reveal stark differences in medical spending and outcomes. The U.S. spends $6,892 more per person than peer nations yet trails in life expectancy and preventable deaths.
Universal coverage works in many countries, with under 2% uninsured rates. France and Germany prove cost-control is possible without sacrificing quality.
Lessons from abroad highlight smarter system designs. Centralized pricing, preventive care, and streamlined administration keep costs low while improving access.
Data-driven reforms could bridge gaps. Borrowing proven strategies—like Germany’s reference pricing or the UK’s NHS budgets—offers a path forward.
FAQ
▶
▶
▶
▶
▶
▶
▶
▶
▶
▶
