The industrial competition between India and China represents one of the most consequential economic narratives of the 21st century. As these two Asian giants continue their rise on the global stage, understanding the comparative strengths and weaknesses of their industrial bases becomes crucial for policymakers, investors, and businesses worldwide. This analysis examines ten critical dimensions of industrial capacity to provide a comprehensive assessment of where each nation stands today and their trajectories for tomorrow.
1. Economic and Industrial Foundations
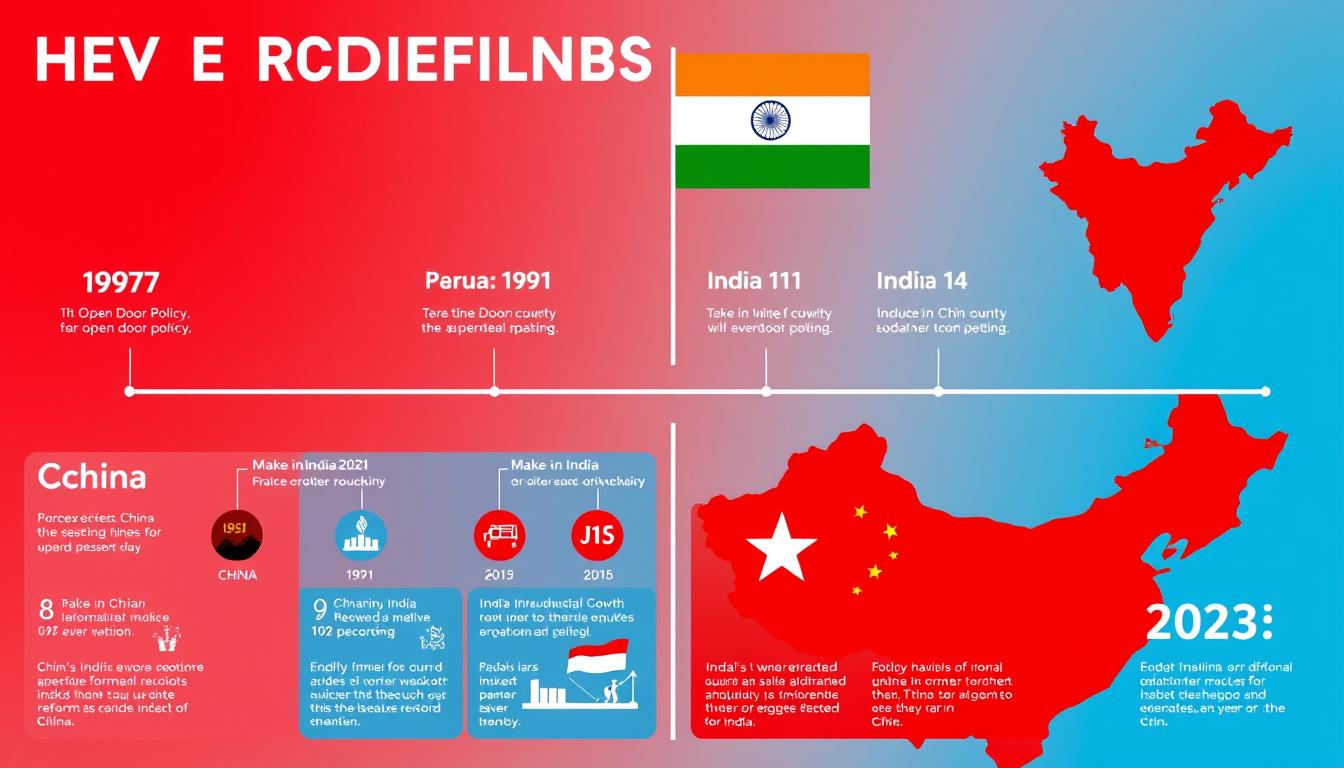
China’s modern industrial journey began with Deng Xiaoping’s economic reforms in 1978, establishing Special Economic Zones that attracted foreign investment while maintaining state control over key sectors. This “socialism with Chinese characteristics” approach created a hybrid system that combined central planning with market mechanisms, allowing China to leverage its massive workforce while building state-owned enterprises into global competitors.
India’s industrial transformation started later, with the 1991 economic liberalization under Finance Minister Manmohan Singh, which dismantled the “License Raj” system that had constrained industrial growth. Unlike China’s state-directed approach, India adopted a more market-oriented model, reducing tariffs, welcoming foreign investment, and privatizing certain industries while maintaining protections for small-scale enterprises.
The divergent paths reflect fundamental differences in governance systems: China’s authoritarian model enabled rapid infrastructure development and industrial policy implementation without political opposition, while India’s democratic framework prioritized consensus-building and balanced regional interests, often at the cost of execution speed.
2. Core Industrial Sectors and Specialization
China’s Industrial Dominance
- Electronics manufacturing (world’s largest producer of smartphones, computers, and telecommunications equipment)
- Rare earth processing (controls approximately 85% of global processing capacity)
- Steel production (produces over 50% of global crude steel)
- Machinery and equipment manufacturing
- Shipbuilding (approximately 40% of global capacity)
India’s Industrial Strengths
- Information technology services and software development
- Pharmaceuticals (largest global provider of generic medicines)
- Textiles and apparel (second-largest exporter after China)
- Automotive manufacturing (fourth-largest auto market globally)
- Chemical production (third-largest in Asia)
China has developed comprehensive industrial ecosystems across multiple sectors, with particular strength in hardware manufacturing and heavy industry. Its industrial policy has systematically moved up the value chain from low-cost manufacturing to advanced production, supported by massive state investments.
India’s industrial landscape shows greater specialization in knowledge-intensive sectors like pharmaceuticals and IT services, leveraging its English-speaking workforce and educational strengths. However, it has struggled to develop the same manufacturing breadth as China, with gaps in electronics and heavy machinery production.
3. Strengths and Weaknesses of Each Industrial Ecosystem
China’s Industrial Ecosystem
- Strengths: Unparalleled supply chain density, world-class infrastructure, strong government coordination, massive domestic market, and efficient logistics networks
- Production efficiency: Highly developed industrial clusters enable rapid scaling and specialization
- Infrastructure: Extensive high-speed rail, modern ports, and reliable power supply support industrial operations
China’s Industrial Challenges
- Weaknesses: Rising labor costs, environmental degradation, energy dependency, and increasing international tensions
- Innovation constraints: Despite improvements, still dependent on foreign technology in critical sectors
- Demographic pressures: Aging population and shrinking workforce threaten long-term productivity
India’s Industrial Ecosystem
- Strengths: Young workforce, growing domestic market, democratic institutions, strong services sector, and improving business environment
- Cost advantage: Labor costs approximately 30-40% lower than China’s
- Demographic dividend: Working-age population continues to grow, unlike China
India’s Industrial Challenges
- Weaknesses: Infrastructure gaps, bureaucratic complexity, fragmented markets, skill deficits, and land acquisition difficulties
- Logistics inefficiency: Transportation costs 2-3 times higher than China
- Power reliability: Frequent outages increase production costs through generator dependence
The contrast between these industrial ecosystems reflects different development models: China’s state-directed approach prioritized infrastructure and manufacturing scale, creating efficient but sometimes environmentally problematic industrial zones. India’s more market-driven approach has produced uneven development, with world-class service sectors alongside manufacturing that struggles with basic infrastructure challenges.
4. Manufacturing Output and Global Rankings
| Metric | China | India | Global Context |
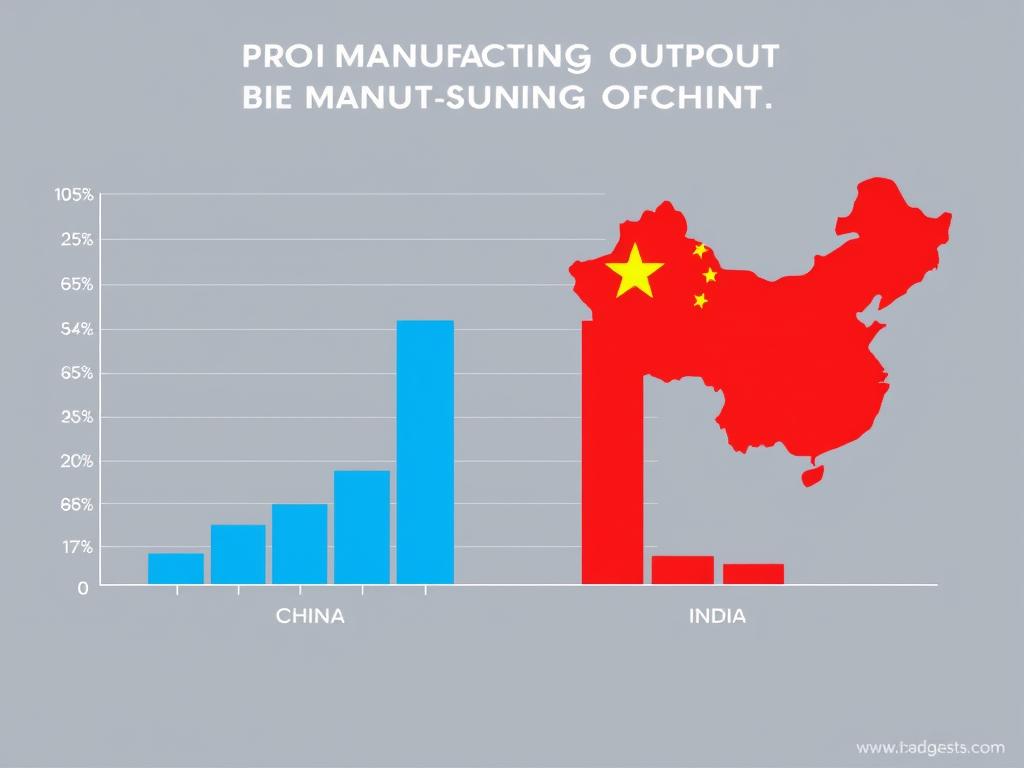
| Manufacturing Output (2023) | $4.98 trillion | $0.98 trillion | China ranks 1st globally, India 5th |
| Manufacturing as % of GDP | 27.4% | 17.2% | Global average: 15.6% |
| UNIDO Competitive Industrial Performance Index Rank (2023) | 2nd | 42nd | 150 countries ranked |
| Manufacturing Value Added Per Capita | $3,542 | $707 | High-income country average: $5,800 |
| Manufacturing Export Share of Total Exports | 93.2% | 72.8% | Global average: 70% |
China’s manufacturing dominance is evident in both absolute terms and relative to GDP. With nearly five times India’s manufacturing output, China has established itself as the world’s factory, producing everything from basic consumer goods to sophisticated electronics and machinery. The country’s manufacturing value-added has grown at an average annual rate of 6.8% over the past decade, though this has slowed from earlier double-digit growth.
India’s manufacturing sector, while substantial in global terms, has not achieved the same centrality to its economy as China’s. The sector has grown at approximately 5.7% annually over the past decade, but its share of GDP has remained relatively stagnant, indicating that services have grown faster. This reflects both India’s comparative advantage in services and the persistent challenges in scaling up manufacturing.
5. Innovation and Technology Integration
China’s Technology Transformation
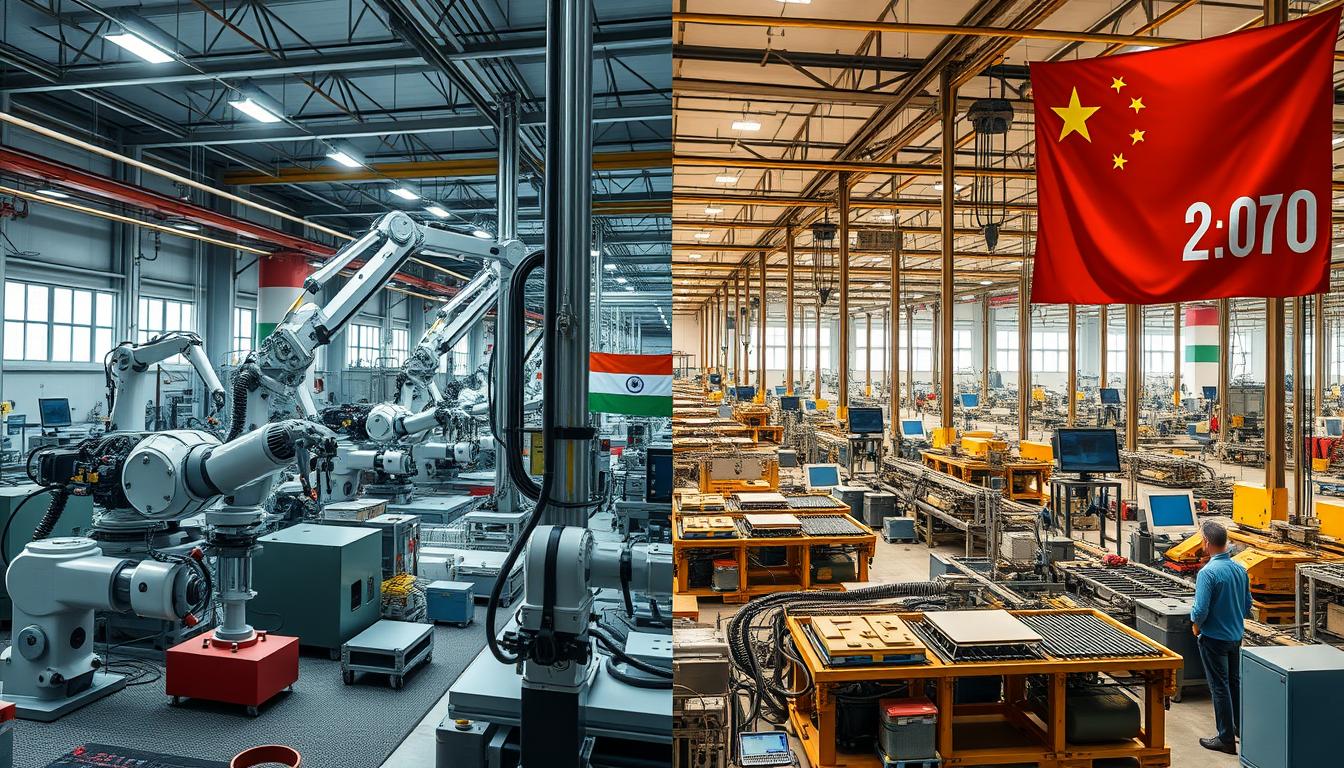
China has aggressively pursued technological advancement through its “Made in China 2025” initiative, which aims to transform the country from a manufacturing giant into a manufacturing superpower. Key metrics illustrate this push:
- Robot density: 322 industrial robots per 10,000 manufacturing workers (2023)
- R&D spending: 2.4% of GDP ($443 billion in 2023)
- Patent applications: 1.6 million in 2023 (highest globally)
- 5G adoption: Over 1.5 million 5G base stations deployed
India’s Technology Evolution
India has launched several initiatives to accelerate technological adoption in manufacturing, including the “Digital India” and “Smart Advanced Manufacturing and Rapid Transformation Hub” (SAMARTH) programs. Progress indicators include:
- Robot density: 99 industrial robots per 10,000 manufacturing workers (2023)
- R&D spending: 0.7% of GDP ($42 billion in 2023)
- Patent applications: 58,000 in 2023
- 5G adoption: Early deployment phase with approximately 100,000 base stations
China’s technological integration in manufacturing shows greater maturity, with widespread adoption of automation, robotics, and digital manufacturing platforms. The country has developed strong capabilities in artificial intelligence applications for quality control and predictive maintenance, while also building domestic capacity in semiconductor manufacturing, though still behind global leaders.
India’s technological transformation is more uneven, with world-class capabilities in software development and IT services alongside manufacturing sectors that vary widely in technology adoption. Leading Indian automotive and pharmaceutical manufacturers employ advanced technologies comparable to global standards, but smaller enterprises often lag in digital integration. India’s strength lies in frugal innovation—developing cost-effective solutions that address local constraints.
6. Sustainability and Environmental Practices
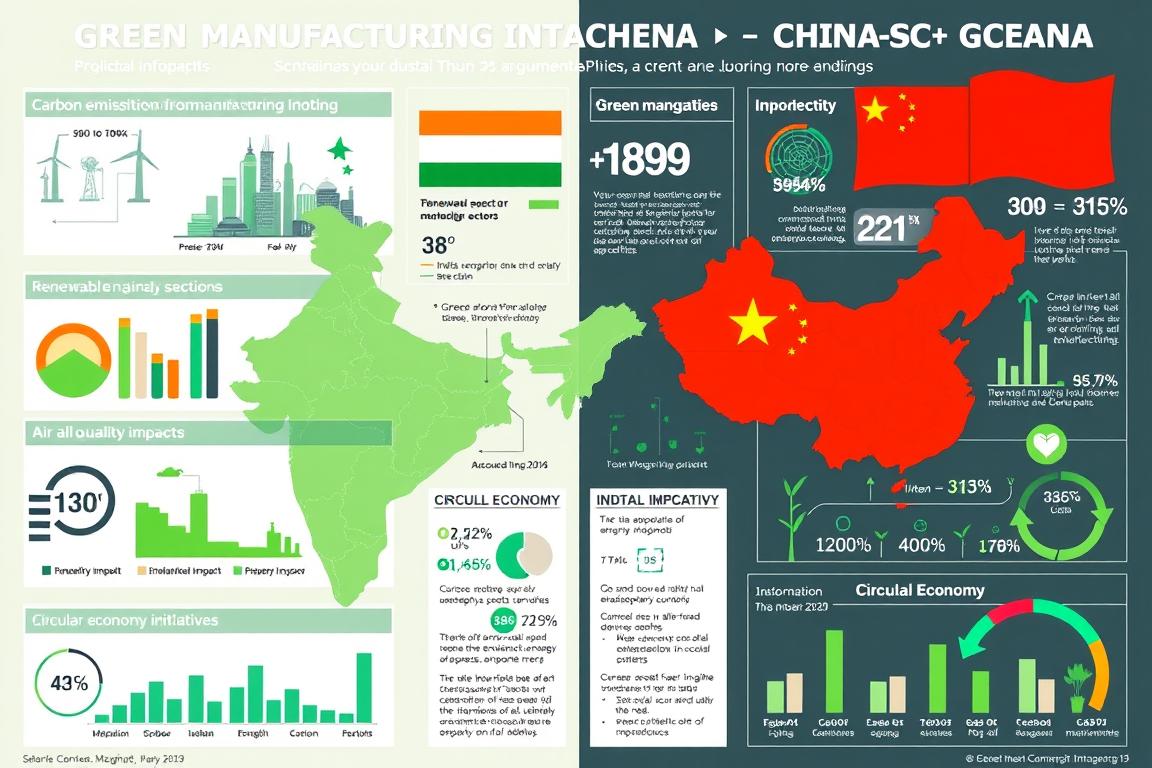
Both China and India face enormous environmental challenges from their industrial sectors, though they differ in scale and approach to remediation. China’s earlier and more intensive industrialization created severe environmental degradation, with manufacturing contributing significantly to air and water pollution. However, China has more recently implemented some of the world’s most ambitious environmental policies.
How does China’s environmental regulation compare to India’s?
China has implemented increasingly stringent environmental regulations, particularly since 2015, with the Environmental Protection Law giving authorities greater enforcement powers. Key initiatives include:
- Mandatory emissions monitoring systems in heavy industry
- Carbon trading scheme covering power generation and heavy industry
- Aggressive targets for electric vehicle adoption
- Commitment to carbon neutrality by 2060
India’s environmental regulatory framework includes the comprehensive Environmental Protection Act, but enforcement remains challenging due to fragmented authority between central and state governments. Recent initiatives include:
- National Clean Air Programme targeting industrial pollution
- Renewable energy capacity targets (500 GW by 2030)
- Energy efficiency certification for industries
- Commitment to net-zero emissions by 2070
China’s greater centralization has enabled more consistent implementation of environmental policies, with visible improvements in air quality in major industrial centers since 2015. The country has also become the world’s largest producer of renewable energy equipment, creating a virtuous cycle between environmental policy and industrial development.
India’s environmental progress has been more varied across regions, with some states like Gujarat implementing effective industrial pollution control while others struggle with enforcement. The country’s lower per capita resource consumption means its overall environmental footprint remains smaller than China’s, though rapidly growing energy demands present significant challenges for sustainable industrial development.
7. Investment, FDI, and Government Incentives
China’s Investment Environment
China has systematically developed its investment framework to support industrial development, evolving from broad incentives for any manufacturing to increasingly targeted support for strategic industries:
- FDI inflows (2023): $189 billion
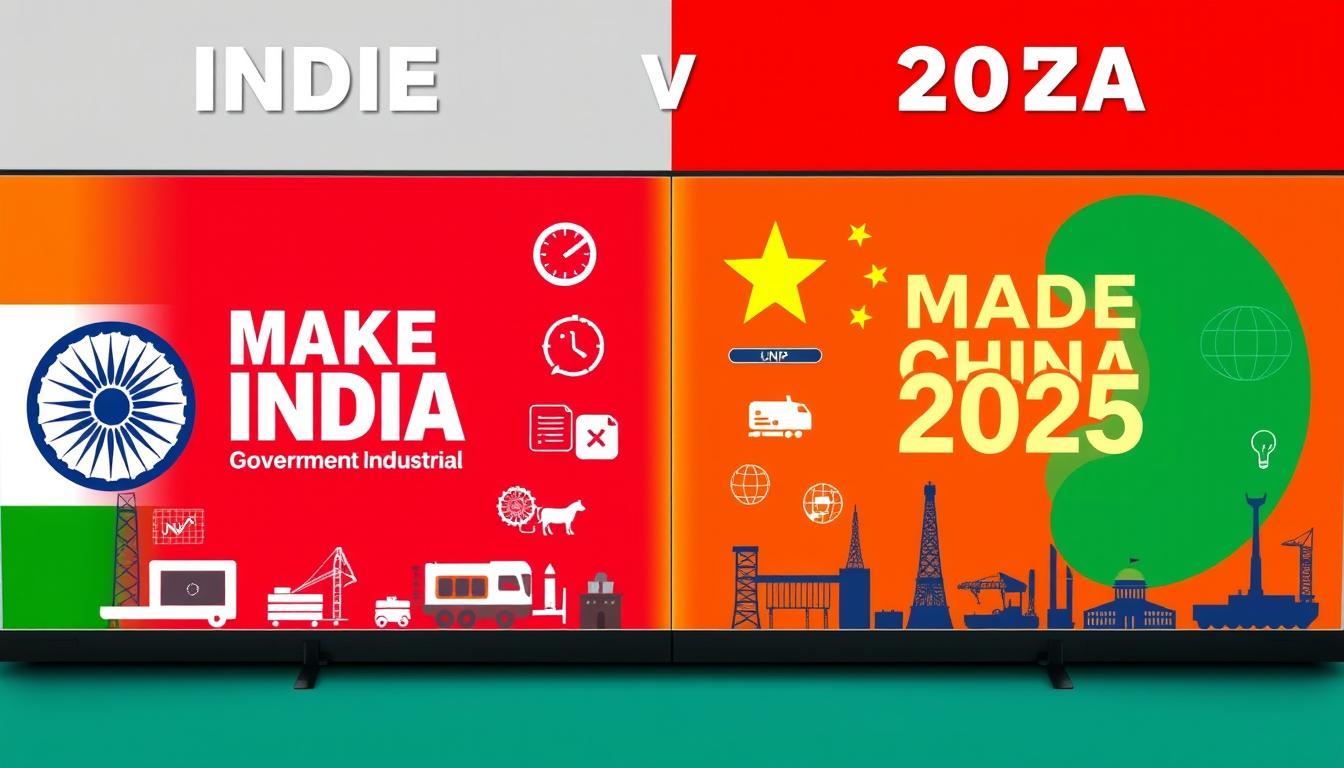
- Key policy: “Made in China 2025” focusing on 10 strategic sectors
- Special Economic Zones: 21 comprehensive zones plus numerous specialized zones
- R&D incentives: 175% super-deduction for qualified R&D expenses
India’s Investment Landscape
India has significantly liberalized its investment regime, particularly since 2014, with the “Make in India” initiative representing a comprehensive effort to attract manufacturing investment:
- FDI inflows (2023): $71 billion
- Key policy: Production-Linked Incentive (PLI) scheme covering 14 sectors
- Special Economic Zones: 268 operational SEZs
- Corporate tax incentives: Reduced to 15% for new manufacturing companies
China’s investment approach has shifted from quantity to quality, with increasing selectivity about the types of foreign investment it seeks to attract. The country has developed sophisticated industrial parks with specialized infrastructure for specific sectors, creating ecosystems that combine domestic and foreign enterprises. However, foreign investors increasingly report concerns about market access restrictions and intellectual property protection.
India’s investment promotion has become more proactive and targeted, with the $26 billion Production-Linked Incentive scheme representing a significant shift toward sectoral focus. The country has also streamlined investment procedures through digital platforms and single-window clearance systems. Nevertheless, investors continue to cite land acquisition challenges, contract enforcement issues, and policy unpredictability as concerns.
8. Export Strength and Global Supply Chain Role
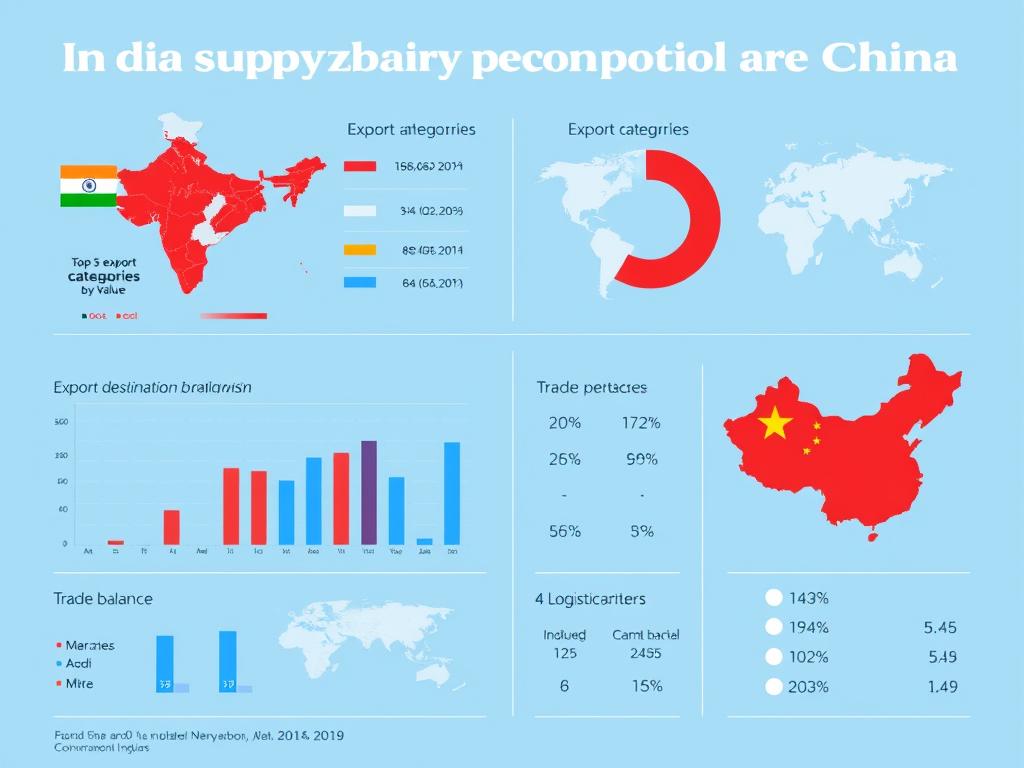
| Export Metric | China | India |
| Total Exports (2023) | $3.37 trillion | $453 billion |
| Top Export Categories | Electronics, machinery, furniture, textiles, vehicles | Petroleum products, pharmaceuticals, jewelry, vehicles, textiles |
| World Export Market Share | 14.2% | 1.9% |
| Logistics Performance Index Rank (2023) | 19th | 38th |
| Average Container Shipping Cost (40ft container to US West Coast) | $3,800 | $5,200 |
China’s position in global supply chains remains unparalleled, with deep integration across multiple industries and the ability to produce complete product ecosystems domestically. The country has systematically moved up the value chain, transitioning from simple assembly to more complex manufacturing and increasingly to design and development. Its logistics infrastructure—including seven of the world’s ten busiest container ports—provides significant competitive advantages.
India’s export profile reflects its industrial strengths in pharmaceuticals, jewelry, and textiles, with growing capabilities in automotive components and machinery. The country has increased its participation in global value chains, though primarily in specific sectors rather than across the industrial spectrum. Recent infrastructure improvements, particularly the Dedicated Freight Corridor and Sagarmala port development program, aim to address longstanding logistics challenges.
Both countries are navigating supply chain reconfiguration driven by geopolitical tensions and resilience concerns. China faces challenges from “friend-shoring” initiatives by Western countries, while India seeks to position itself as an alternative manufacturing hub through initiatives like the India-Middle East-Europe Economic Corridor.
9. Workforce and Demographic Advantage
China’s Workforce Dynamics
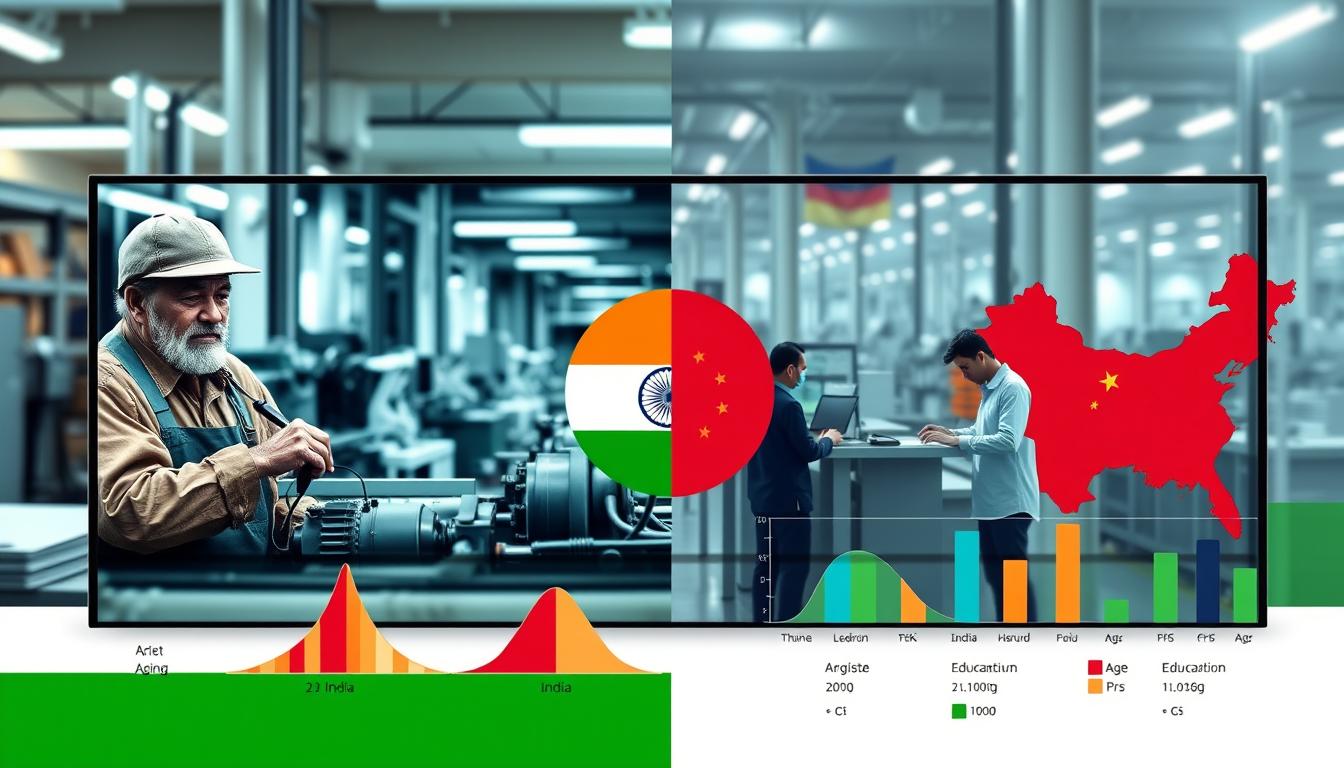
China’s industrial workforce is experiencing significant demographic shifts that impact its manufacturing competitiveness:
- Manufacturing workforce: Approximately 112 million workers
- Median age: 38.4 years and rising
- Average manufacturing wage: $8,400 annually (2023)
- Tertiary education enrollment: 58.4%
- Vocational training graduates: 4.7 million annually
India’s Workforce Landscape
India’s demographic profile presents both opportunities and challenges for industrial development:
- Manufacturing workforce: Approximately 58 million workers
- Median age: 28.7 years
- Average manufacturing wage: $3,100 annually (2023)
- Tertiary education enrollment: 28.6%
- Vocational training graduates: 1.3 million annually
China’s workforce challenges include rapidly rising wages, which have increased at approximately 8-10% annually over the past decade, eroding its low-cost manufacturing advantage. The country’s aging population means fewer new workers entering manufacturing, while urbanization rates approaching 65% limit further rural-to-urban migration that previously fueled industrial growth. In response, China has accelerated automation and upskilling initiatives.
India’s “demographic dividend” provides a potential competitive advantage, with 12 million new workers entering the labor market annually. However, skill mismatches remain significant, with employers reporting difficulties finding adequately trained workers despite high unemployment. The country’s female labor force participation rate of 24% (compared to China’s 61%) represents both a challenge and an opportunity for expanding the industrial workforce.
Both countries are investing heavily in workforce development, with China focusing on advanced manufacturing skills and India implementing the Skill India initiative to train 400 million workers by 2030. The effectiveness of these programs will significantly influence future industrial competitiveness.
10. Challenges Ahead and Strategic Outlook
Key Challenges for China’s Industrial Future
- Energy security: High dependency on imported oil (73%) and natural gas (42%)
- Geopolitical tensions: Trade restrictions affecting access to advanced technologies
- Demographic decline: Working-age population projected to shrink by 35 million by 2030
- Environmental constraints: Water scarcity affecting 11 provinces with major industrial bases
- Debt sustainability: Local government debt potentially limiting infrastructure investment
Key Challenges for India’s Industrial Future
- Infrastructure gaps: $1.4 trillion investment needed by 2030
- Skill development: Only 4.7% of workforce has formal vocational training
- Land acquisition: Complex procedures delaying industrial projects
- Energy reliability: Transmission losses of 17% compared to global average of 8%
- Administrative complexity: Multiple regulatory layers increasing compliance costs
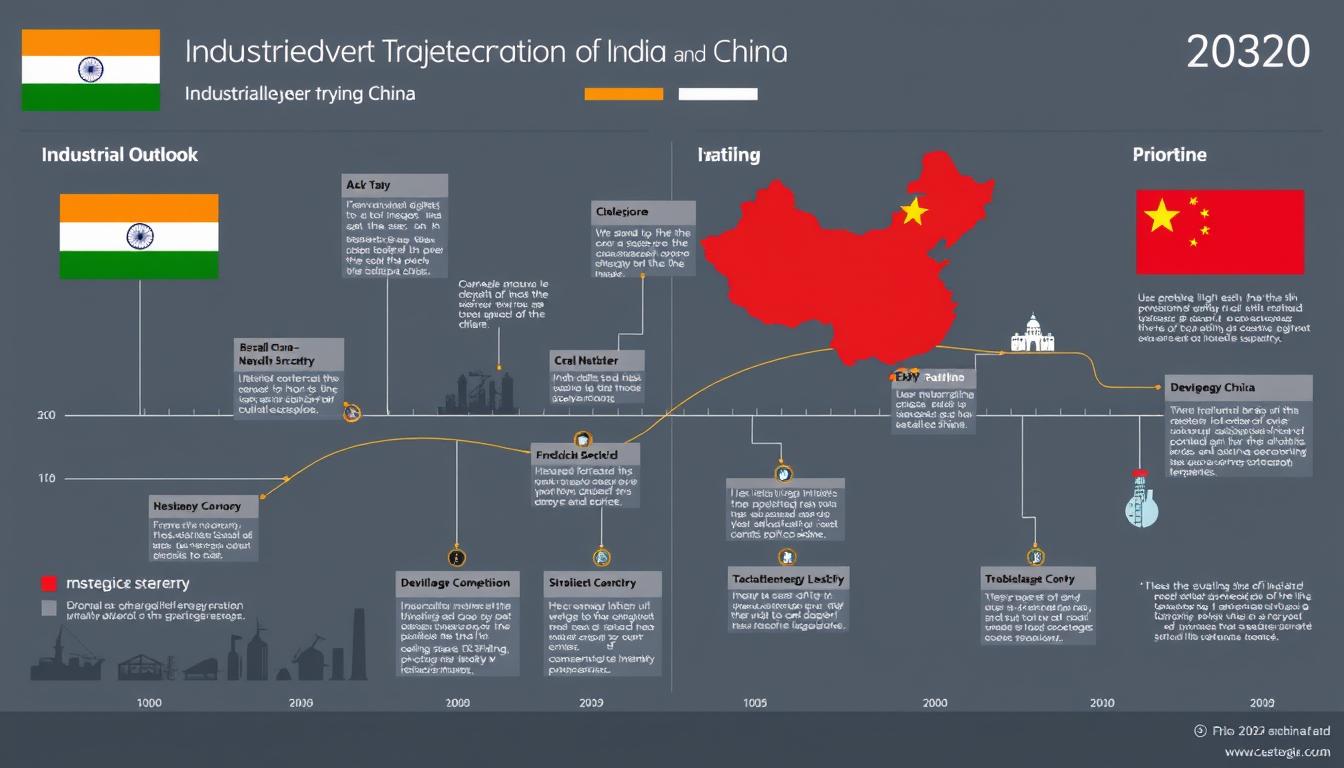
China’s industrial strategy is increasingly focused on technological self-reliance and moving up the value chain. The “dual circulation” policy aims to reduce dependency on export markets while leveraging China’s massive domestic market. Key initiatives include the $1.4 trillion “new infrastructure” investment program focusing on 5G networks, data centers, and artificial intelligence, alongside continued support for strategic industries like semiconductors and aerospace.
India’s industrial outlook centers on leveraging its demographic advantage and positioning as an alternative manufacturing destination amid supply chain diversification. The National Infrastructure Pipeline and Gati Shakti initiative aim to address longstanding infrastructure constraints, while the Production-Linked Incentive scheme targets building manufacturing scale in strategic sectors. India’s growing domestic market, projected to reach $6 trillion by 2030, provides a foundation for industrial expansion.
The competitive dynamics between these industrial giants will significantly influence global manufacturing patterns, with China’s established scale and ecosystem depth competing against India’s cost advantages and improving business environment. Both countries face the challenge of balancing industrial growth with environmental sustainability and navigating an increasingly complex geopolitical landscape.
Conclusion: The Balance Sheet of Industrial Power
The India vs China industrial base comparison reveals contrasting models of development with distinct advantages. China maintains clear leadership in manufacturing scale, infrastructure quality, and ecosystem completeness, with its industrial output nearly five times larger than India’s. Its systematic approach to industrial policy has created unparalleled manufacturing capabilities across multiple sectors, though rising costs and geopolitical tensions present growing challenges.
India offers competitive advantages in workforce demographics, cost structures, and democratic governance, positioning it as a potential beneficiary of supply chain diversification. Its industrial base shows particular strengths in pharmaceuticals, automotive manufacturing, and textiles, though infrastructure limitations and administrative complexities continue to constrain growth potential.
Rather than viewing this as a zero-sum competition, the evolution of these industrial bases may increasingly lead to complementary specialization, with China focusing on capital-intensive, technology-driven manufacturing while India leverages its cost advantages in labor-intensive sectors while building capabilities in knowledge-intensive industries. For global businesses and policymakers, understanding these distinct industrial profiles and their future trajectories will be essential for effective strategy development in the Asian century.
