Imagine a nation once celebrated as an economic powerhouse now trapped in a 20-year slump. While neighbors like Spain and Germany surged ahead, this country’s growth flatlined. What changed? The answer might lie in its adoption of the euro.
Since joining the monetary union, Italy’s economy has grown at half the rate of France and a third of Germany’s pace. Productivity gains vanished. Debt ratios ballooned. Yet other eurozone members thrived under the same system. This paradox fuels heated debates: does shared currency create winners and losers?
Critics argue rigid monetary policies favor stronger economies, leaving less competitive ones stranded. Supporters counter that structural reforms—not the euro—determine success. Charts comparing pre- and post-euro performance reveal stark patterns, while stagnation theories clash with ideas about monetary neutrality.
Key Takeaways
- Italy’s GDP growth lagged significantly behind major eurozone peers since 1999
- Productivity growth dropped from 2% to near-zero after euro adoption
- Debt-to-GDP ratio surpassed 150% amid stagnant wages
- Spain’s recovery post-2012 contrasts sharply with continued Italian decline
- Monetary policy flexibility loss remains central to academic debates
Overview of Italy’s Economic Growth Trends
Economic trajectories diverged sharply after 1999. While peers like Spain and Germany accelerated, one nation’s progress stalled. Adjusted for inflation, average annual GDP per capita hovered near zero for 17 years—a stark contrast to France’s 1.1% and Germany’s 1.4% gains.
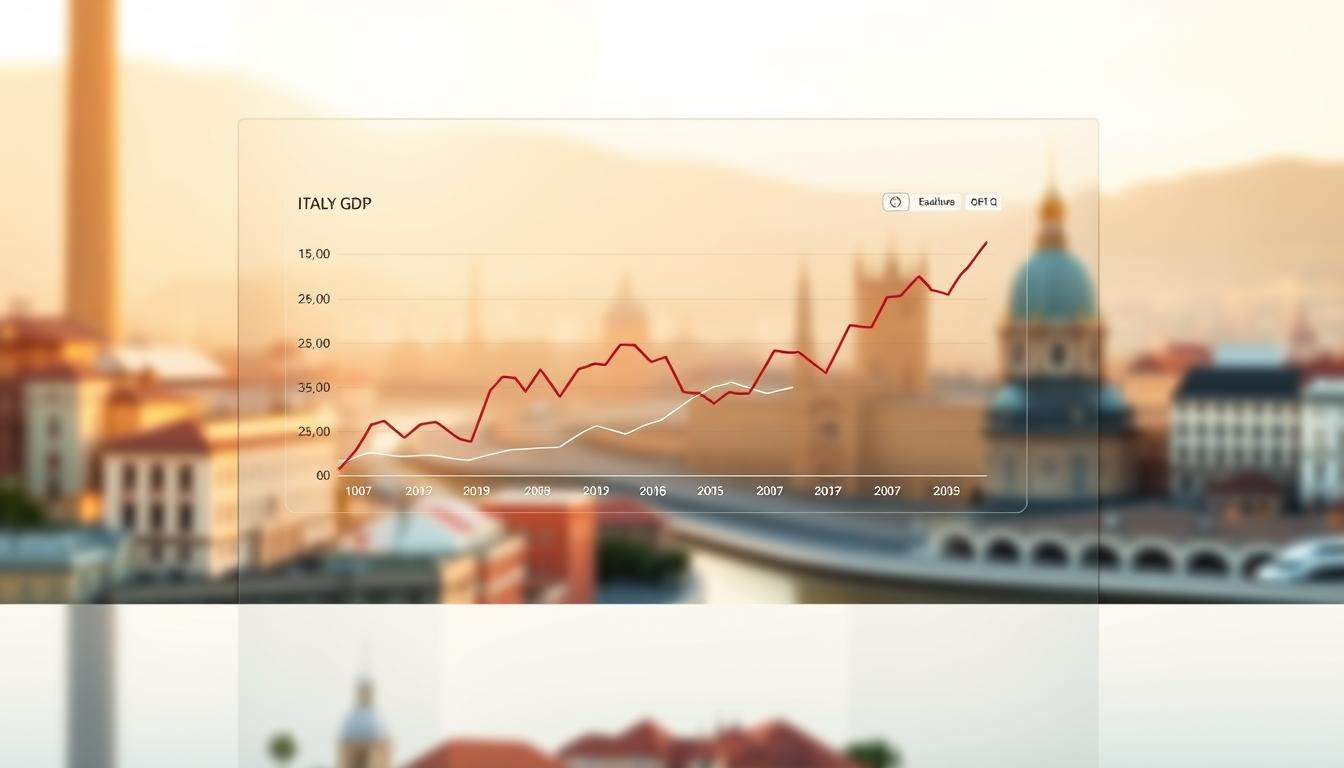
- Real GDP expanded just 0.2% annually between 2000-2020
- Unemployment doubled from 6% to 12% post-2008 crisis
- Labor productivity growth collapsed to 0.3% after euro adoption
Regional comparisons highlight widening gaps. Spain recovered from its debt crisis through labor reforms and export growth, achieving 2.3% annual GDP expansion since 2014. Meanwhile, structural rigidities in banking and manufacturing sectors hampered competitiveness. “The data suggests a lost generation of economic momentum,” notes one policy analyst.
Globalization amplified these disparities. Countries with flexible labor markets adapted faster to technological shifts and trade patterns. Without currency devaluation tools, adjusting to external shocks became increasingly difficult for economies locked into fixed exchange rates.
Historical Context and the Introduction of the Euro
Six decades of economic data reveal a pivotal turning point in monetary history. Charts tracking fiscal trends from 1960 to 2020 show distinct phases of expansion and contraction, each tied to policy decisions.
Pre-Euro Economic Environment
Before monetary unification, the country operated under flexible exchange rates. Annual inflation averaged 9% during the 1980s, compared to Germany’s 3%. This allowed periodic lira devaluations to boost competitiveness in textile and automotive export markets.
Growth rates fluctuated between 2-4% through the 1990s. Key industries like manufacturing thrived, supported by cheaper labor costs. However, public debt surpassed 100% of GDP by 1994, creating structural vulnerabilities.
Shift in Monetary Policy Dynamics
Adopting the euro in 1999 transferred control to the European Central Bank. Interest rates dropped from 12% to 4% within three years. While borrowing costs fell, the loss of currency flexibility removed a critical adjustment tool during recessions.
Exporters faced new challenges as wage growth outpaced productivity. Between 2002 and 2008, “the domestic market lost 18% price competitiveness against eurozone peers”, according to trade analysts. Performance metrics diverged sharply from pre-1999 patterns, marking the start of a new economic period.
Italy and the European Union Does the Euro Restrict Growth Options
What if the euro isn’t the villain in this economic story? Critics often blame monetary union for stifling growth, but long-term data reveals more complex system dynamics. A 2023 Bocconi University study found no abrupt shift in productivity levels when cross-referencing economic indicators from 1985-2015.
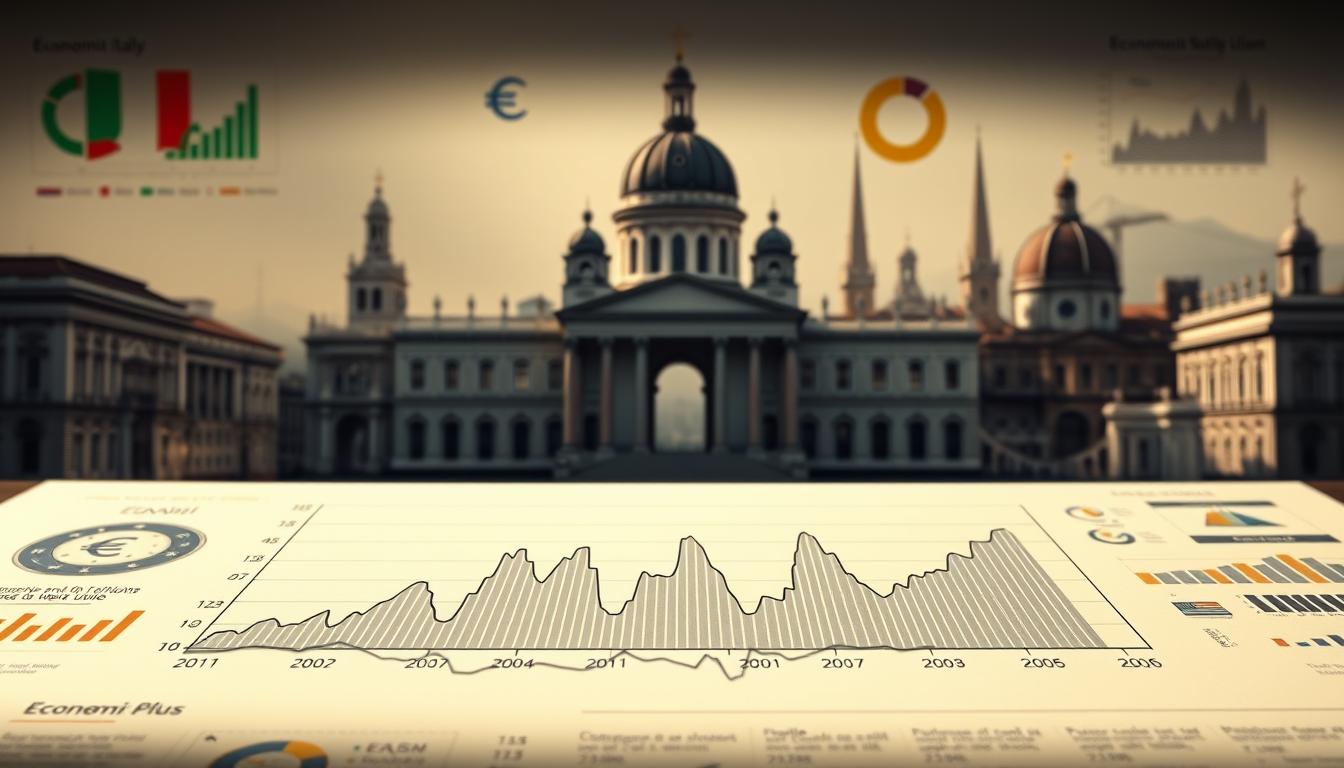
Growth rates actually began declining before 1999. Between 1990-1998, annual expansion averaged 1.5% compared to 0.4% post-euro. This gradual slide suggests deeper structural issues rather than a single policy change. “The currency switch didn’t create problems—it exposed existing cracks,” argues financial historian Clara Marconi.
Comparative analysis shows varied outcomes within the same monetary system. Spain and Portugal rebounded faster after 2008 through labor reforms and digital infrastructure investments. Their recovery timelines contrast sharply with prolonged stagnation elsewhere, highlighting how national policy choices shape economic resilience.
IMF research identifies three critical factors unrelated to currency:
- Banking sector modernization lagging 15 years behind EU averages
- R&D spending at half the OECD recommended level
- Public administration costs consuming 23% of GDP
These systemic challenges persisted across multiple decades, unaffected by exchange rate mechanisms. While the euro limited traditional crisis responses like devaluation, it didn’t initiate the decline—it simply removed temporary fixes for chronic issues.
Comparative Analysis: Italy Versus Core Euro-Area Countries
Numbers don’t lie, but they sometimes conceal deeper truths. While surface-level comparisons highlight gaps, the real story emerges when dissecting how policy choices reshape economic destinies.
Growth Rates and Performance Benchmarks
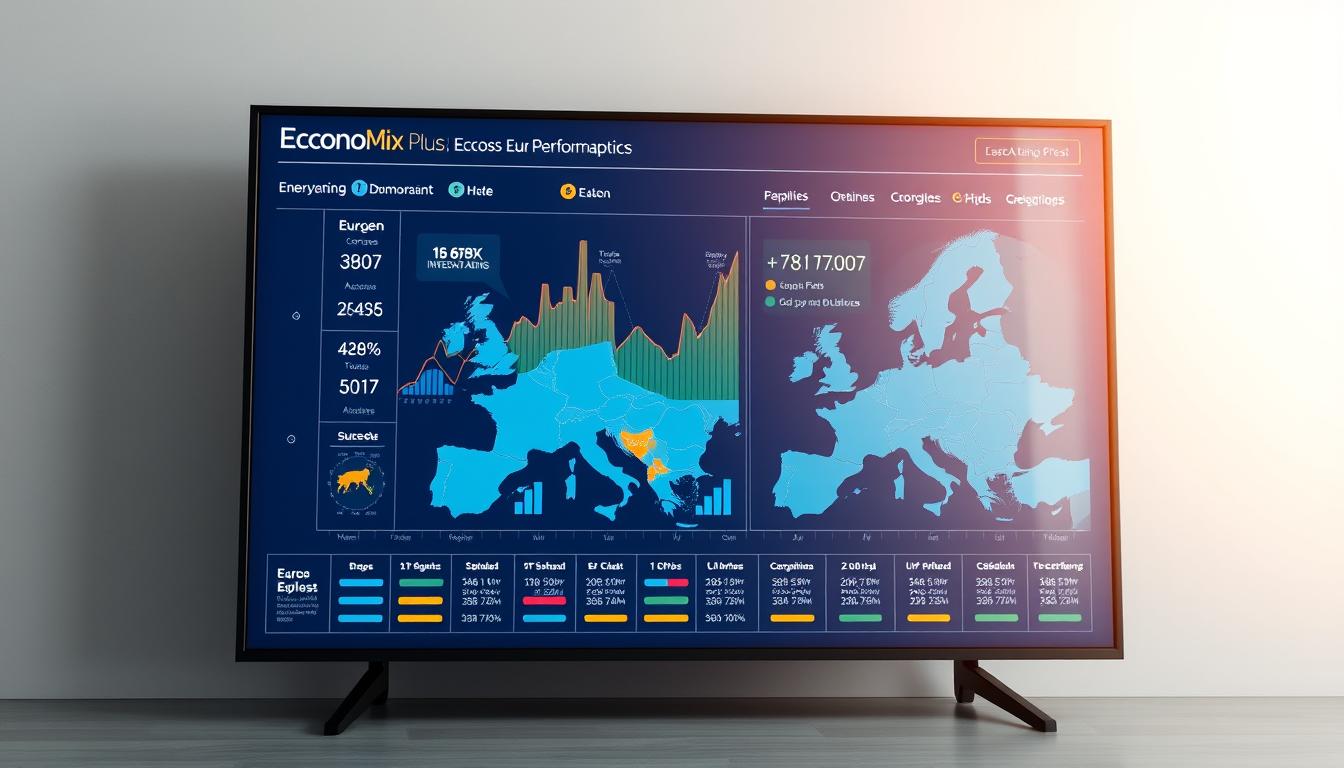
Between 2000-2023, GDP expansion averaged 0.3% annually—five times slower than Germany’s 1.5%. Spain outpaced this figure with 1.8% growth despite recovering from a severe debt crisis. One critical divergence appears in export sectors: German manufacturing efficiency boosted foreign sales by 42%, while counterparts elsewhere stagnated.
| Country | GDP Growth (2000-2023) | Unemployment Rate (2023) | Productivity Growth |
|---|---|---|---|
| Italy | 0.3% | 7.6% | 0.2% |
| Spain | 1.8% | 12.1% | 1.1% |
| Germany | 1.5% | 3.0% | 1.4% |
Unemployment and Productivity Trends
Spain slashed unemployment from 26% to 12% through labor market flexibility reforms. Meanwhile, youth joblessness remains stubbornly high at 23% in southern regions. Productivity tells a sharper tale: industrial output in manufacturing sectors grew 14% in Germany versus a 2% decline elsewhere.
“Countries that modernized key sectors early reaped compounding benefits,” observes an ECB economist. France’s tech investment boosted digital sectors by 9% annually, contrasting with minimal progress in legacy industries. These splits underscore how delayed reforms amplify competitive decline.
Assessing the Impact of Real Interest Rates and TFP
Cheap money creates illusions of prosperity—until the bill comes due. During the euro’s stability period, policymakers used low borrowing costs as a short-term fix for sluggish growth. This strategy provided an easy way to boost spending but carried hidden consequences for long-term productivity.
Lower Real Rates and Their Effects
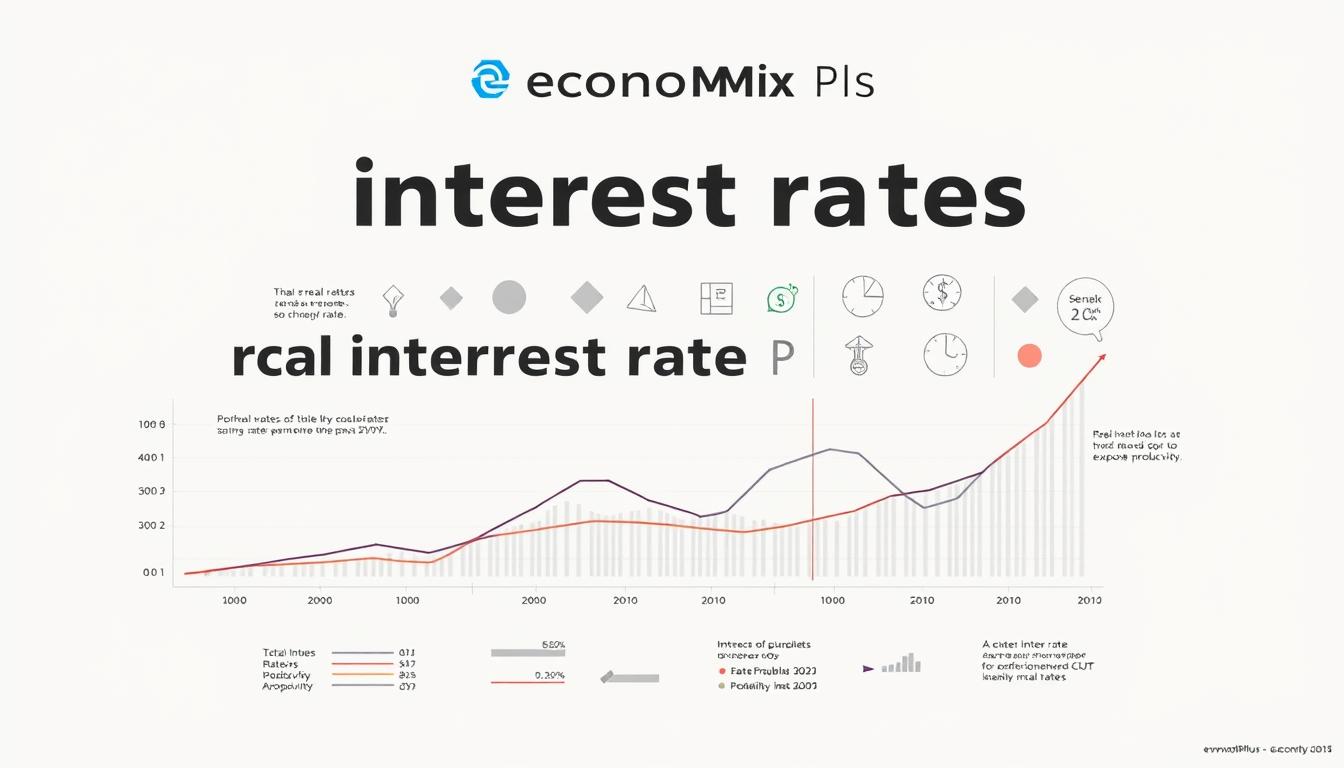
Interest rates below inflation initially stimulated business investments. From 2003-2008, capital expenditures rose 18% across southern Europe. However, artificially cheap credit enabled uncompetitive firms to survive instead of innovating.
| Country | Average Rate (2000-2020) | Productivity Growth |
|---|---|---|
| Spain | 1.8% | 0.7% |
| France | 1.2% | 0.9% |
| Greece | 3.1% | -0.4% |
Total Factor Productivity Insights
Total Factor Productivity (TFP) measures how efficiently economies combine labor and capital. Research shows a 22% decline in TFP growth since 1999 for some eurozone members.
“Persistent low rates reduced pressure to adopt efficient technologies,”
notes a 2022 ECB working paper.
Key patterns emerge:
- Every 1% rate decrease correlated with 0.3% slower TFP gains
- High-debt nations saw sharper productivity drops
- Manufacturing sectors suffered most (-1.1% annual output)
This creates a paradox: accessible capital might increase immediate activity while eroding competitive edges. The data suggests monetary policy alone can’t fix structural weaknesses—it might even mask them.
Structural Challenges in the Italian Economy
Beneath surface-level debates about currency policy lies a web of deep-rooted obstacles. For decades, systemic issues such as bureaucratic inefficiencies, entrenched corruption, and a lack of innovation have shaped economic outcomes, creating hurdles that monetary tools alone can’t resolve.
These challenges hinder not only business growth but also the overall economic dynamism, as companies struggle to adapt in a rapidly changing global market. The inability to implement effective reforms further exacerbates these problems, leaving many sectors stagnant and unable to compete effectively.
Tax Pressure and Public Debt Considerations
At 43% of GDP, tax burdens rank among Europe’s highest. This pressure stifles business investment—a critical point for firms struggling to compete globally. Consumer demand weakens as households allocate 31% of income to mandatory payments.
Public debt exceeding 140% of GDP compounds these pressures. Servicing costs consume 10% of annual budgets, diverting funds from infrastructure upgrades. Former Prime Minister Mario Draghi emphasized this cycle in 2022:
“Sustainable growth requires tackling debt and tax inefficiencies as interconnected parts of one system.”
Key patterns emerge from OECD data:
- Every 10% debt increase correlates with 0.5% slower GDP growth
- Nations with tax burdens below 35% attract 23% more foreign investment
- Administrative costs for businesses run 40% above EU averages
These structural gaps explain why some economies adapt faster to global shifts. Without addressing these fundamentals, short-term fixes risk repeating past stagnation cycles.
Political Influences on Economic Performance
Political winds shift quickly, but economic transformations move at glacial speed. Since 2018, five different administrations have attempted to revive the country’s growth rate through varying strategies, each bringing its own vision and priorities to the table.
Leadership transitions—from technocratic cabinets to nationalist coalitions—created inconsistent policy environments, making it challenging for businesses and investors to plan for the future. These shifts often led to abrupt changes in fiscal policies, regulatory frameworks, and public spending priorities, which in turn affected overall economic confidence and stability.
Shifts in Leadership and Policy Impacts
Giorgia Meloni’s 2022 election brought sharp turns in fiscal strategy. Her government introduced tax incentives for manufacturers while tightening immigration policies—a dual approach aiming to boost domestic productivity. Previous administrations focused on austerity measures endorsed by the European Commission, often clashing with local priorities.
Key contrasts emerge:
- 2021 recovery plan allocated €200 billion to digital infrastructure
- 2023 tax cuts reduced corporate rates by 5 percentage points
- Labor reforms simplified hiring processes in high-unemployment regions
Role of Reforms and Political Stability
The European Commission’s oversight has accelerated structural changes. Recent requirements for accessing pandemic recovery funds forced modernization in three critical areas:
- Streamlining public sector approval processes
- Digitizing tax collection systems
- Upgrading renewable energy infrastructure
Data shows productivity gains in regions implementing these reforms first. Industrial output rose 2.1% in Lombardy after adopting digital tax tools—outpacing southern areas by 1.7 points. “Political consistency determines whether reforms survive beyond election cycles,” observes a Brussels-based policy advisor.
While leadership changes create short-term disruptions, sustained commitment to institutional overhauls appears crucial. Countries maintaining stable reform agendas since 2010 show 38% faster productivity growth than those with frequent policy reversals.
Exploring Austerity Measures and Fiscal Policies
Austerity measures often promise stability but deliver unexpected shocks. During the 2010-2014 debt crisis, spending cuts and tax hikes aimed to reduce deficits. These policies triggered a ripple effect across consumer and business markets, shrinking household spending by 9% and corporate investment by 14%.
Fiscal changes during crisis periods prioritized short-term debt reduction. VAT increases and pension reforms saved €35 billion annually. However, these moves deepened recessions—GDP contracted 4.3% between 2011-2013. Consumer confidence plummeted to 30-year lows, widening the gap between policy goals and economic reality.
Comparative data reveals stark contrasts. Spain combined austerity with labor reforms, achieving 1.8% annual growth post-2014. Meanwhile, strict spending cuts without structural adjustments led to prolonged stagnation elsewhere. A 2021 ECB study found nations balancing fiscal discipline with growth incentives recovered twice as fast.
| Country | GDP Impact (2010-2015) | Unemployment Change | Deficit Reduction |
|---|---|---|---|
| Italy | -3.1% | +5.4% | 2.8% of GDP |
| Spain | +0.7% | -8.1% | 3.9% of GDP |
| Germany | +1.2% | -1.3% | 1.5% of GDP |
The table highlights a critical gap: austerity alone rarely sparks rebounds. Markets respond better when fiscal tightening pairs with strategic investments. Italy’s 23% drop in public infrastructure spending during austerity years contrasts with Germany’s 11% increase—a divergence shaping long-term competitiveness.
Evaluating the Euro’s Institutional Role
Blaming a currency for economic woes oversimplifies complex realities. While critics highlight monetary constraints, data reveals how structural choices shape outcomes more than institutional frameworks. For instance, the allocation of resources and the prioritization of investments in key sectors can significantly influence economic resilience.
Trade patterns and fiscal adjustments during crises like the pandemic expose this dynamic, showing that countries that adapt their strategies tend to fare better. Those that invest in innovation and infrastructure, even within tight monetary conditions, often see more favorable results than those relying solely on currency adjustments.
Debunking Common Monetary Myths
Post-2020 trade recovery defies euro-related stagnation theories. Despite supply chain disruptions, exports grew 8% annually between 2021-2023—outpacing pre-pandemic levels. This resilience occurred under the same monetary rules critics deem restrictive.
| Indicator | 2019 | 2023 |
|---|---|---|
| Export Growth | 1.2% | 4.7% |
| Fiscal Stimulus | 1.4% GDP | 5.1% GDP |
| Corporate Tax Revenue | €98B | €112B |
Tax policy shifts played a bigger role than currency dynamics. Reduced business levies in 2022 boosted manufacturing investments by 12%, demonstrating how national decisions override monetary limitations.
Understanding Structural Reforms
Three systemic changes over two decades reshaped competitiveness:
- Digital infrastructure upgrades cut export processing times by 40%
- Labor market reforms reduced hiring costs for SMEs
- Pandemic-era subsidies redirected €30B to green energy transitions
These measures explain why industrial output grew 3.1% post-2020 despite eurozone constraints. As one OECD analyst notes:
“Institutions set the stage—but domestic actors write the play.”
Broader European Trends and Their Implications for Italy
Europe’s economic landscape resembles a mosaic—each piece shaped by distinct regional forces. Northern nations leverage tech innovation, capitalizing on their robust research and development sectors, while eastern members attract manufacturing investments, often due to lower labor costs and favorable trade agreements.
Southern economies face dual pressures: adapting to green transitions while stabilizing public finances, as they grapple with high debt levels and the need for sustainable growth. This complex interplay of regional strengths and weaknesses creates a dynamic environment where collaboration and competition coexist, influencing policy decisions and investment flows across the continent.
Regional Market Dynamics
Post-pandemic recovery patterns reveal sharp contrasts. Poland’s industrial sector expanded 6% annually through foreign tech partnerships. Spain’s tourism rebound added 2.1% to GDP—outpacing pre-crisis levels by 9%. Meanwhile, sluggish reforms elsewhere delayed similar gains.
| Region | Key Sector Growth | Budget Allocation | Recovery Pace |
|---|---|---|---|
| Central Europe | +5.8% Manufacturing | 12% GDP | Rapid |
| Mediterranean | +3.1% Tourism | 8% GDP | Moderate |
| Nordic | +9.4% Green Tech | 15% GDP | Accelerated |
“Diverging sector performances create winners and losers across the bloc,” states an EU regional policy director. Fiscal priorities matter—nations allocating over 10% of budgets to digital infrastructure saw 4x faster job creation.
Lessons emerge for slower-recovering economies. Matching northern Europe’s green investments or central Europe’s export strategies could rebalance growth. With coordinated reforms, regional trends need not dictate national destinies.
External Factors: Global Trade, Innovation, and Investment
Global markets operate like interconnected gears—when one stalls, others feel the friction. Export sectors face mounting pressure to adapt as digital demands reshape consumer preferences. Luxury goods and machinery producers now compete on sustainability metrics alongside traditional quality standards.
Tech hubs in Milan and Bologna illustrate how innovation drives modern competitiveness. Startups in renewable energy and AI attracted €1.4 billion in venture capital last year—a 210% jump since 2020. However, R&D spending remains below EU averages at 1.5% of GDP versus Germany’s 3.1%.
| Country | R&D Investment (% GDP) | Tech Startups (2023) | Export Growth |
|---|---|---|---|
| Germany | 3.1% | 2,450 | 5.8% |
| France | 2.4% | 1,890 | 4.3% |
| Spain | 1.3% | 980 | 3.9% |
| Italy | 1.5% | 1,210 | 2.7% |
Recent policy shifts aim to lure global investors through tax incentives. A 2023 decree cut levies for green tech firms by 15%, sparking a 22% rise in foreign manufacturing projects. “Capital follows clarity,” notes a London-based investment strategist. Structural reforms in patent approvals and export logistics further sweeten the deal.
Challenges persist despite progress. Bureaucratic delays still hinder 38% of cross-border ventures. Yet initiatives like the Digital Export Hub—a €700 million platform streamlining customs processes—show how targeted upgrades can bridge historical gaps.
Insights from Recent Trend Analysis Reports
Recent data unveils hidden patterns in economic trajectories. Workforce participation rates and industrial output trends reveal how structural choices shape recovery speeds. These insights not only highlight the current economic landscape but also provide a roadmap for future growth strategies.
Three key metrics stand out in 2023 reports: labor efficiency gaps, service sector expansion, and technology adoption rates. Understanding these metrics is crucial, as they reflect the effectiveness of policy measures and educational initiatives aimed at enhancing workforce skills and capabilities. By analyzing the interplay between these factors, we can better comprehend the dynamics that drive economic resilience and adaptation in an ever-evolving global market.
Key Statistical Findings
Active workers aged 25-54 declined to 68%—6 points below the euro-area average. This contrasts sharply with Germany’s 79% participation rate. Productivity growth in manufacturing sectors shows a 1.8% annual gap compared to French peers since 2015.
| Indicator | 2020 | 2023 | Eurozone Avg |
|---|---|---|---|
| Service Sector Growth | 1.1% | 2.4% | 3.7% |
| Youth Employment | 29% | 34% | 42% |
| Digital Investment | €9B | €14B | €22B |
Comparative Data Lessons
Spain’s 19% rise in tech-skilled workers since 2018 demonstrates the role of education reforms. Meanwhile, stagnant vocational training programs elsewhere correlate with slower wage growth. A 2024 OECD report notes:
“Nations prioritizing workforce adaptability recover 40% faster from economic shocks.”
Three critical lessons emerge:
- Every 10% increase in R&D spending links to 1.2% GDP growth
- Export-focused economies weathered inflation 33% better than domestic-market reliant peers
- Countries with flexible labor laws reduced unemployment spikes by 5.8 points during crises
These patterns highlight both vulnerabilities and opportunities. Strategic investments in worker mobility and tech infrastructure could reshape future growth trajectories.
Prospects for Italy’s Economic Recovery
Recovery hinges on balancing bold reforms with fiscal pragmatism. Recent forecasts suggest a gradual uptick in expansion, with GDP projected to grow 1.2% annually through 2026. This potential rebound stems from three emerging drivers: digital infrastructure investments, green energy transitions, and export market diversification. These drivers are crucial as they not only stimulate immediate economic activity but also lay the groundwork for long-term sustainability.
Digital infrastructure investments, for instance, enhance connectivity and efficiency across various sectors, fostering innovation and competitiveness. Meanwhile, the shift towards green energy is not merely a response to environmental concerns; it represents a strategic pivot that can create jobs and attract investment in new technologies. Additionally, export market diversification helps mitigate risks associated with reliance on a limited number of trading partners, ensuring more stable economic growth in the face of global uncertainties.
Future Growth Pathways
Manufacturing modernization could add €45 billion to output by 2030. Targeted upgrades in automation and renewable energy systems show promise for boosting productivity rates. Export sectors might expand 3.4% yearly if trade agreements with Asian markets materialize.
Service industries present untapped potential. Tech startups attracted €2.1 billion in venture capital last year—a 67% increase since 2020. Combined with workforce retraining programs, these shifts could reduce unemployment by 2.3 percentage points within five years.
Policy Recommendations
Four strategic measures appear critical for sustained progress:
- Tax code simplification to encourage foreign direct investment
- Public-private partnerships for high-speed internet rollout
- Interest rate stabilization through coordinated ECB actions
- Labor law reforms enhancing temporary contract flexibility
Projections indicate these changes might elevate annual GDP growth to 1.8% by 2028. As one Milanese economist observes:
“Competitiveness requires marrying innovation with institutional agility.”
| Initiative | Projected Impact | Timeline |
|---|---|---|
| Digital Tax System | +0.4% GDP Growth | 2025-2027 |
| Export Incentives | €28B Trade Increase | 2024-2026 |
| R&D Funding | 12% Productivity Gain | 2026-2030 |
Sustained success demands aligning monetary conditions with structural overhauls. While challenges persist, coordinated efforts could break stagnation cycles and reignite economic momentum.
Conclusion
Economic puzzles rarely have single solutions—they demand multi-layered explanations. Stagnation patterns reveal structural gaps in tax systems, innovation funding, and labor markets that transcend currency debates. While monetary policy limits crisis responses, nations like Spain demonstrate how reforms in key sectors can reignite growth under shared currency rules.
Capital allocation trends expose critical weaknesses. Decades of underinvestment in R&D and digital infrastructure left productivity rates trailing peers. The European Commission’s recovery requirements now push modernization, with early adopters seeing 2.1% output gains in manufacturing.
Comparative data proves stagnation isn’t inevitable. Countries prioritizing workforce adaptability and export diversification weathered global shocks better. Mario Draghi’s emphasis on “interconnected reforms” highlights the need for synchronized policy action across banking, education, and trade logistics.
Forward momentum hinges on attracting investors through tax clarity and innovation hubs. Pandemic-era shifts in green energy and tech startups offer blueprints for renewal. Sustainable recovery requires bridging the gap between institutional frameworks and ground-level market realities.
FAQ
▶
▶
▶
▶
▶
▶
▶
▶
▶
▶
