The global smart TV landscape is dominated by two technological titans: Samsung and Sony. These industry leaders have shaped viewing experiences for decades, each bringing distinct philosophies and innovations to our living rooms. As consumers and industry stakeholders navigate an increasingly complex market, understanding the fundamental differences between these manufacturers becomes crucial for informed decision-making. This comprehensive analysis examines both companies through multiple dimensions—from technological innovation and market positioning to financial performance and sustainability initiatives—providing a data-driven perspective on who truly leads the smart TV market.
Company Overview and Specialization
Samsung Electronics, headquartered in Suwon, South Korea, operates as part of the larger Samsung Group conglomerate. Founded in 1969, the company has evolved into one of the world’s largest technology manufacturers with approximately 267,000 employees globally. While Samsung’s business spans semiconductors, mobile devices, home appliances, and digital solutions, its Visual Display division (responsible for TVs) represents a cornerstone of its consumer electronics strategy, accounting for approximately 17% of its total revenue according to 2024 financial reports.
Sony Group Corporation, based in Tokyo, Japan, was established in 1946 and employs around 109,700 people worldwide. Unlike Samsung’s broader electronics focus, Sony maintains a more diversified portfolio that includes entertainment (music, movies, gaming) alongside its electronics division. This unique positioning allows Sony to function as both a content creator and hardware manufacturer. Within this ecosystem, Sony’s TV business operates under its Electronics Products & Solutions segment, contributing roughly 12% to overall corporate revenue based on 2024 financial data.
The fundamental difference in corporate structure influences each company’s approach to the TV market. Samsung leverages vertical integration and manufacturing scale, controlling everything from panel production to final assembly. Sony, while outsourcing panel manufacturing, focuses on image processing technology and premium positioning, creating synergy between its content production and display technology divisions.
Core Strengths and Weaknesses
Samsung: Manufacturing Powerhouse

Samsung’s dominance in the smart TV market stems primarily from its unparalleled manufacturing capabilities. As both a panel producer and TV manufacturer, Samsung maintains control over the entire supply chain, enabling cost efficiencies that competitors struggle to match. The company’s investment in quantum dot (QLED) and Neo QLED technologies has allowed it to offer premium picture quality while avoiding the higher production costs associated with OLED panels.
According to industry analyst firm Omdia, Samsung’s economies of scale allow it to produce TVs at approximately 15-20% lower cost than competitors who must source panels externally. This manufacturing advantage translates to aggressive pricing strategies across all market segments, from budget to premium models. Additionally, Samsung’s rapid innovation cycle—typically refreshing its entire lineup annually—keeps its product range current with the latest features and specifications.
However, Samsung’s weaknesses include a less sophisticated smart TV operating system compared to competitors. Its Tizen platform, while functional, lacks the content discovery capabilities and app ecosystem depth of Google TV (used by Sony). Samsung has also faced criticism for aggressive advertising within its smart TV interface, potentially compromising user experience in favor of additional revenue streams.
Sony: Processing Excellence

Sony’s reputation in the TV market is built on superior image processing technology rather than manufacturing scale. The company’s Cognitive Processor XR represents the culmination of decades of image science research, enabling Sony TVs to deliver what many reviewers consider the most accurate and natural picture quality in the industry. This processing advantage is particularly evident in motion handling, upscaling of lower-resolution content, and color accuracy.
Sony’s integration with the broader entertainment ecosystem represents another significant strength. As both a major film studio (Sony Pictures) and music label (Sony Music Entertainment), the company can optimize its displays specifically for content creation standards. This synergy is exemplified by features like “Creator Mode,” which displays content precisely as directors intended.
The primary weakness in Sony’s approach is its dependence on external panel suppliers, primarily LG Display for OLED panels and various manufacturers for LED panels. This dependency limits Sony’s ability to compete on price and restricts production capacity during supply chain disruptions. Additionally, Sony’s premium positioning strategy, while preserving brand value, has resulted in limited market share in mid-range and entry-level segments where volume sales occur.
Samsung Strengths
- Vertical integration from panel production to final assembly
- Superior economies of scale reducing production costs
- Aggressive pricing across all market segments
- Rapid innovation cycle with annual lineup refreshes
- Leading brightness capabilities with QLED technology
Samsung Limitations
- Less sophisticated smart TV operating system
- Aggressive advertising within user interface
- Inconsistent quality control across price tiers
- No support for Dolby Vision HDR format
- Limited synergy with content creation standards
Sony Strengths
- Superior image processing with Cognitive Processor XR
- Integration with entertainment ecosystem (Sony Pictures, Music)
- Industry-leading motion handling and upscaling
- Accurate color reproduction and creator-focused calibration
- Google TV platform with superior content discovery
Sony Limitations
- Dependence on external panel suppliers
- Higher price points limiting market penetration
- Limited presence in entry-level and mid-range segments
- Smaller production capacity during supply constraints
- Less frequent product refresh cycles
Technology and Innovation
Screen Technologies Compared

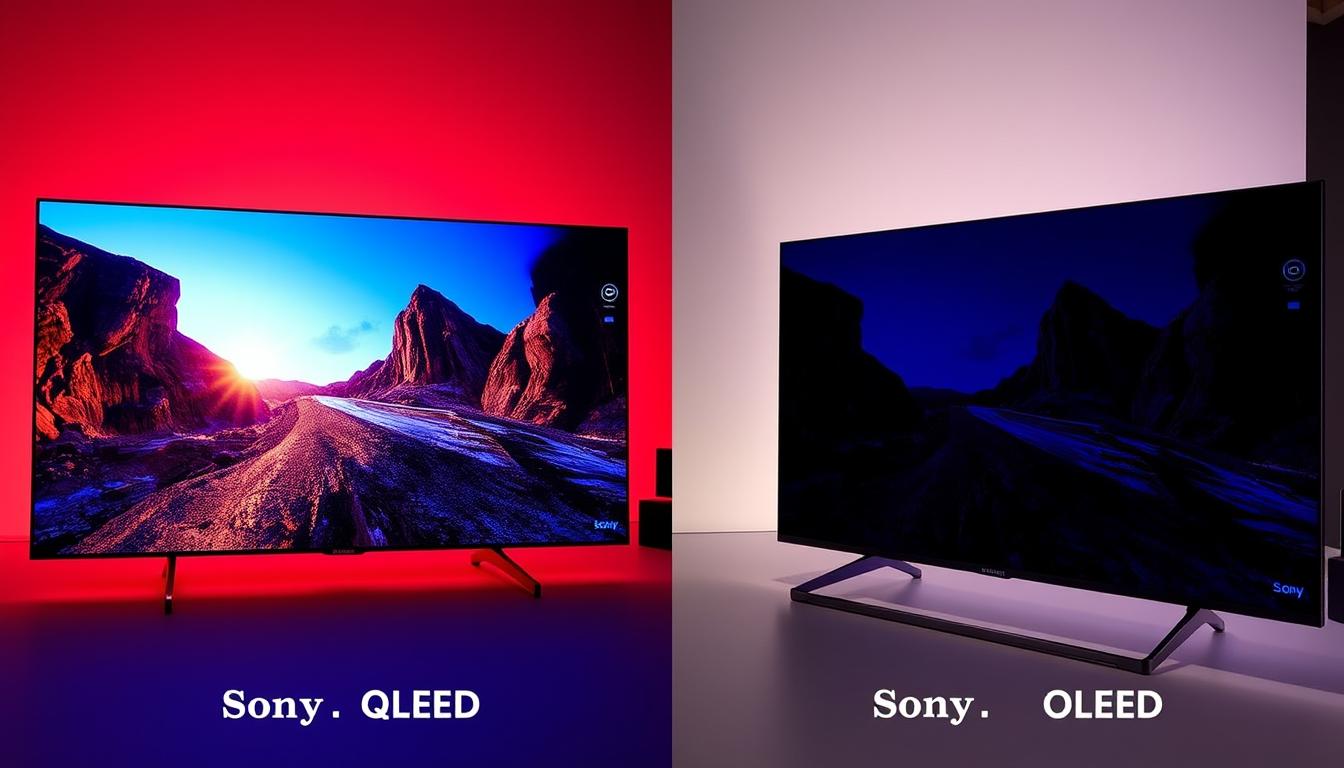
The technological approaches of Samsung and Sony represent fundamentally different philosophies toward achieving premium picture quality. Samsung has invested heavily in quantum dot technology (QLED and Neo QLED), which enhances the brightness and color volume of traditional LED-LCD displays. Sony, while offering LED-LCD options, has embraced OLED technology for its flagship models, prioritizing perfect black levels and infinite contrast.
Samsung’s latest Neo QLED technology combines quantum dots with Mini LED backlighting, featuring thousands of precisely controlled dimming zones. This approach achieves brightness levels exceeding 2,000 nits in HDR highlights—approximately double what OLED panels can produce. The trade-off comes in black level performance, where even advanced local dimming cannot match OLED’s pixel-level light control.
Sony’s OLED implementation, using panels manufactured by LG Display but with proprietary processing, delivers perfect blacks and infinite contrast ratio. While peak brightness (typically 700-1,000 nits) remains lower than Samsung’s QLED offerings, Sony’s processing algorithms maximize perceived dynamic range through precise tone mapping. Sony has also introduced QD-OLED models that incorporate quantum dot technology with OLED, attempting to combine the strengths of both approaches.
| Technology Aspect | Samsung Approach | Sony Approach |
| Primary Display Technology | Neo QLED (Mini LED with Quantum Dots) | OLED and Mini LED (BRAVIA XR series) |
| Peak Brightness | 1,500-2,000+ nits | 700-1,000 nits (OLED), 1,200-1,500 nits (LED) |
| Black Level Performance | Very good (local dimming zones) | Perfect (OLED), Very good (Mini LED) |
| Color Volume | 100% DCI-P3, ~85% Rec.2020 | 98% DCI-P3, ~80% Rec.2020 |
| Processing Engine | Neo Quantum Processor with AI | Cognitive Processor XR |
| Motion Handling | 120Hz native, Motion Xcelerator | 120Hz native, XR Motion Clarity |
| HDR Format Support | HDR10, HDR10+, HLG (No Dolby Vision) | HDR10, Dolby Vision, HLG |
Processing and AI Capabilities

Beyond panel technology, processing capabilities represent a crucial differentiator between Samsung and Sony TVs. Samsung’s Neo Quantum Processor employs 20 neural networks to enhance upscaling, reduce noise, and optimize picture settings based on content type. This AI-driven approach allows Samsung TVs to improve lower-quality content and automatically adjust picture parameters for different viewing scenarios.
Sony’s Cognitive Processor XR takes a different approach, analyzing content in a way that mimics human visual perception. Rather than processing the entire image uniformly, Sony’s system identifies focal points—areas where viewers naturally concentrate their attention—and prioritizes processing resources accordingly. Independent testing by RTINGS and other technical reviewers consistently ranks Sony’s upscaling and motion processing as industry-leading, particularly for challenging content like sports broadcasts and film-based 24fps material.
Both manufacturers have invested heavily in gaming-specific features, with Samsung focusing on low input lag (as low as 5.8ms) and support for variable refresh rates up to 144Hz. Sony, leveraging its PlayStation division expertise, offers features like Auto HDR Tone Mapping and Auto Genre Picture Mode specifically optimized for PlayStation 5 consoles. According to Digital Foundry testing, both manufacturers achieve comparable gaming performance, though Samsung offers slightly lower input lag while Sony provides better motion clarity.
Sustainability and Manufacturing Responsibility

As environmental concerns become increasingly important to consumers and regulators, both Samsung and Sony have implemented significant sustainability initiatives in their TV manufacturing processes. Samsung’s “Eco-Package” program, launched in 2020, redesigns TV packaging to minimize waste and enable creative reuse. The company reports a 10% reduction in packaging materials and estimates that its solar-powered remote control has prevented disposal of 99 million AAA batteries since its introduction.
Sony’s “Road to Zero” environmental plan aims for a zero environmental footprint across the product lifecycle by 2050. For its TV division, this translates to concrete measures like reducing product weight by an average of 30% since 2018, decreasing power consumption by up to 40% in newer models, and incorporating recycled plastics in TV components. According to Sony’s 2024 sustainability report, approximately 85% of materials in new BRAVIA models are now recyclable.
In terms of energy efficiency, both manufacturers have made significant strides. Samsung’s 2024 Neo QLED lineup achieves Energy Star certification across all models, with power consumption reduced by an average of 25% compared to 2020 equivalents. Sony’s BRAVIA XR OLED models are particularly energy-efficient, consuming approximately 30% less power than comparable LED-LCD models of the same screen size.
| Sustainability Metric | Samsung Performance | Sony Performance |
| 2024 ESG Rating (MSCI) | AA (Leader) | AAA (Leader) |
| Carbon Neutrality Target | 2050 (company-wide) | 2040 (company-wide) |
| Recycled Materials Usage | ~30% in TV components | ~35% in TV components |
| Packaging Recyclability | 95% | 98% |
| Energy Efficiency Improvement (vs. 2018) | 25% reduction | 30% reduction |
While both companies demonstrate commitment to sustainability, independent ESG (Environmental, Social, and Governance) ratings from MSCI show Sony with a slight edge, achieving AAA status compared to Samsung’s AA rating. This difference primarily stems from Sony’s more aggressive carbon neutrality timeline (2040 vs. Samsung’s 2050) and slightly higher use of recycled materials in product manufacturing.
Financial Performance in the TV Division

Financial performance provides crucial insight into the business health of each company’s TV division. According to consolidated financial reports and industry analyst estimates, Samsung’s Visual Display business generated approximately $31.2 billion in revenue for fiscal year 2023, representing a 3.2% increase year-over-year despite challenging market conditions. Operating profit margins for the division stood at approximately 9.7%, reflecting Samsung’s ability to maintain profitability through manufacturing efficiencies despite price pressure from competitors.
Sony’s Home Entertainment & Sound segment, which includes its TV business, reported revenue of $7.8 billion for fiscal year 2023, a slight decrease of 1.8% from the previous year. However, operating profit margins improved to 7.3% (up from 6.8% in 2022), demonstrating Sony’s successful pivot toward higher-margin premium models. This strategic shift toward profitability over volume has been a consistent theme in Sony’s TV business over the past five years.
When contextualizing these figures within each company’s broader operations, Samsung’s TV division contributes approximately 17% to overall corporate revenue, making it a significant but not dominant business unit. For Sony, TV manufacturing represents roughly 12% of total revenue, with higher contributions coming from the Game & Network Services division (PlayStation) at 27% and the Financial Services segment at 16%.
| Financial Metric (FY 2023) | Samsung TV Division | Sony TV Division |
| Revenue | $31.2 billion | $7.8 billion |
| Year-over-Year Growth | +3.2% | -1.8% |
| Operating Profit Margin | 9.7% | 7.3% |
| R&D Investment (% of Revenue) | 6.8% | 8.2% |
| Contribution to Corporate Revenue | 17% | 12% |
Analysis of five-year trends reveals Samsung’s consistent revenue growth in its TV division, averaging 4.3% annually despite global market challenges. Sony has prioritized margin improvement over revenue growth, with average annual revenue declining by 0.7% while operating margins improved from 4.5% in 2019 to 7.3% in 2023. This divergent approach reflects each company’s strategic priorities: Samsung leveraging scale and manufacturing efficiency to drive volume, while Sony focuses on premium positioning to maintain profitability despite lower unit sales.
Brand Reputation and Customer Loyalty

Brand perception and customer loyalty metrics provide valuable insight into how consumers view Samsung and Sony TVs beyond technical specifications. According to J.D. Power’s 2024 TV Satisfaction Report, Sony ranks highest in customer satisfaction among premium TV manufacturers with a score of 889 (out of 1,000), while Samsung follows closely at 872. Sony’s advantage stems primarily from higher ratings in picture quality and sound performance, while Samsung scores better in value and smart features.
Consumer Reports reliability data presents a slightly different picture, with Samsung TVs showing a 4% failure rate within the first five years of ownership, compared to Sony’s 3%. This marginal difference suggests comparable build quality and longevity between the two manufacturers, though Sony maintains a slight edge. When examining brand loyalty metrics from YouGov’s BrandIndex, Samsung demonstrates stronger customer retention, with 67% of Samsung TV owners purchasing another Samsung for their next TV, compared to 58% for Sony.
Industry recognition through awards and critical reception also influences brand perception. Sony has consistently dominated the “Reference TV” designations from technical review sites like RTINGS and HDTVTest, with its flagship models frequently cited as the closest to professional reference monitors used in content creation. Samsung, meanwhile, has received more “Value Pick” and “Best for Bright Rooms” recommendations, reflecting its strength in delivering high brightness and feature-rich experiences at competitive price points.
After-sales support represents another dimension of brand reputation. Sony’s more limited product range allows for more specialized customer support, with technical representatives demonstrating deeper product knowledge according to Consumer Reports satisfaction surveys. Samsung’s global scale enables more localized support centers and faster parts availability, though customer satisfaction scores for technical support are slightly lower than Sony’s (84% vs. 89% satisfaction).
Global Production and Supply Chain Strategy

The manufacturing and supply chain strategies of Samsung and Sony reveal fundamental differences in their approaches to TV production. Samsung operates a highly vertically integrated model with eight dedicated TV manufacturing facilities globally: two in South Korea, two in China, and one each in Mexico, Hungary, Vietnam, and India. This distributed manufacturing network allows Samsung to optimize production based on regional demand and minimize shipping costs and import duties.
Samsung’s vertical integration extends to component production, with the company manufacturing approximately 70% of components used in its TVs, including panels, processors, and many electronic components. This self-sufficiency provided Samsung with significant advantages during recent supply chain disruptions, allowing it to maintain production levels while competitors faced component shortages.
Sony employs a fundamentally different approach, operating just three TV assembly facilities globally (in Malaysia, Slovakia, and Mexico) while relying heavily on contract manufacturers and external component suppliers. Most notably, Sony sources OLED panels exclusively from LG Display and LED panels from various suppliers including AUO, Sharp, and BOE. This approach reduces capital investment requirements but increases dependency on external partners.
| Supply Chain Aspect | Samsung Approach | Sony Approach |
| Manufacturing Facilities | 8 owned facilities across 6 countries | 3 owned facilities, plus contract manufacturing |
| Panel Sourcing | In-house production (Samsung Display) | External (LG Display, AUO, Sharp, BOE) |
| Processor Production | In-house (Samsung System LSI) | Mixed (some in-house, some MediaTek) |
| Component Self-Sufficiency | ~70% in-house | ~30% in-house |
| Supply Chain Resilience (2021-2023) | High (minimal production disruption) | Moderate (some production constraints) |
The COVID-19 pandemic and subsequent supply chain disruptions highlighted the strengths and weaknesses of each approach. Samsung’s vertical integration allowed it to maintain more consistent production levels throughout 2021-2023, with manufacturing capacity reduced by only 12% at the height of component shortages according to IDC data. Sony experienced more significant disruptions, with production capacity reduced by up to 27% during the same period, primarily due to panel supply constraints.
Geopolitical tensions have also influenced manufacturing strategies, with both companies reducing dependence on Chinese manufacturing. Samsung has shifted significant production capacity to Vietnam and India, while Sony has increased its reliance on Malaysian manufacturing. These shifts reflect concerns about tariffs, intellectual property protection, and supply chain resilience in an increasingly complex global trade environment.
Current and Future Challenges

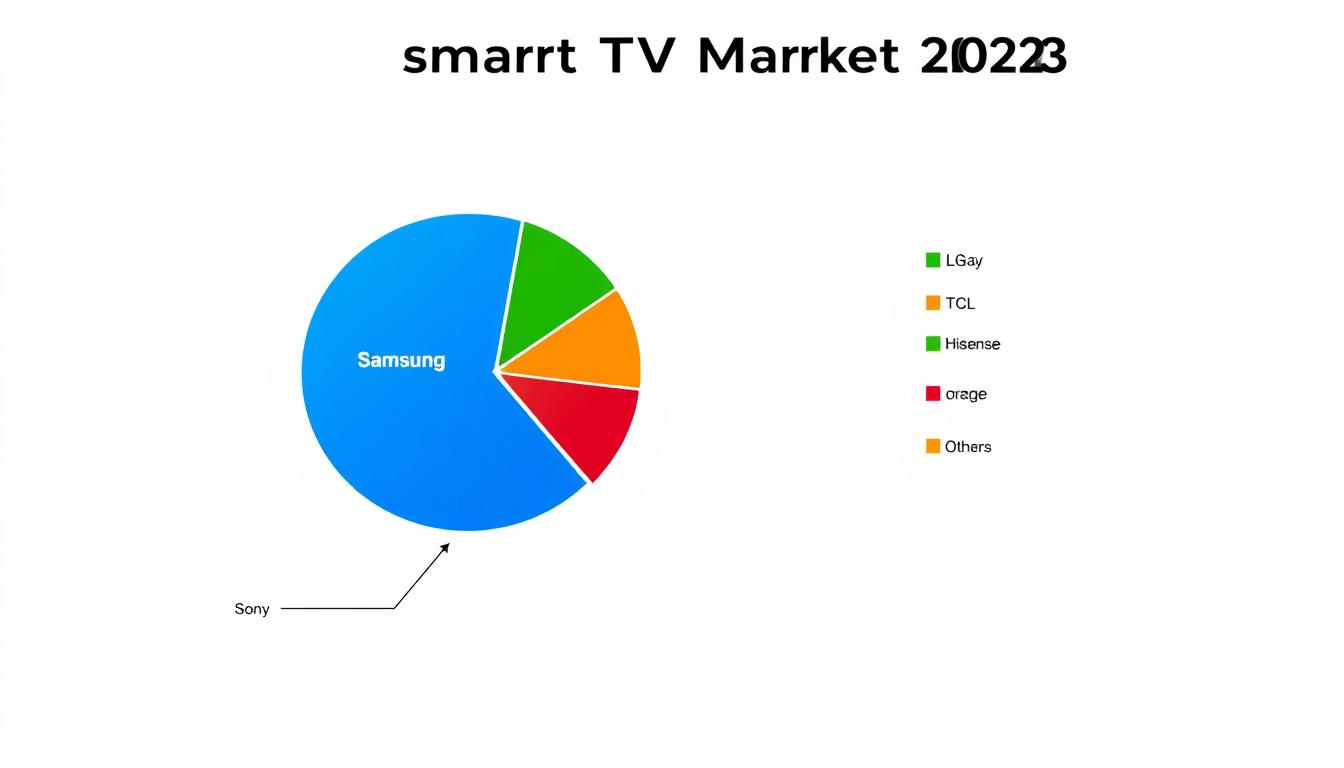
Both Samsung and Sony face significant challenges in maintaining their market positions amid rapidly evolving industry dynamics. Perhaps the most immediate threat comes from Chinese manufacturers like TCL and Hisense, which have dramatically improved product quality while maintaining aggressive pricing. According to Omdia data, TCL has already surpassed Sony in global unit sales, capturing 10.7% market share in 2023 compared to Sony’s 7.2%. Hisense follows closely at 7.0% and is projected to overtake Sony by 2025 if current trends continue.
These Chinese competitors benefit from significant government subsidies, vertical integration comparable to Samsung’s, and lower labor costs. Their rapid technology adoption—TCL now offers Mini LED technology comparable to Samsung’s Neo QLED at substantially lower prices—threatens the premium positioning of both established brands. Samsung has responded by further emphasizing quantum dot technology and design aesthetics, while Sony has doubled down on image processing advantages and entertainment ecosystem integration.
Another significant challenge comes from the rise of streaming-first displays and changing consumer viewing habits. As content consumption shifts increasingly toward streaming services, the value proposition of traditional smart TVs faces pressure from lower-cost alternatives like Roku TVs and Amazon Fire TV Edition displays. These products, which prioritize content access over display technology sophistication, have gained significant traction in entry-level and mid-range segments.
Responding to Market Evolution

Both manufacturers have implemented strategic initiatives to address these challenges. Samsung has accelerated its push into larger screen sizes (75″+ category), where profit margins remain higher and Chinese competition is less established. According to Display Supply Chain Consultants (DSCC), the 75″+ segment grew by 23% in 2023 while the overall TV market remained flat, representing a significant opportunity for premium positioning.
Sony has focused on strengthening its ecosystem integration, particularly between BRAVIA TVs and PlayStation gaming consoles. Features like Auto HDR Tone Mapping and Auto Genre Picture Mode create tangible benefits for PlayStation users, encouraging brand loyalty across product categories. Sony has also expanded its “Perfect for PlayStation” certification to include specific TV models optimized for gaming performance.
Both companies have invested heavily in AI capabilities, moving beyond simple picture enhancement to content recommendation, user interface personalization, and smart home integration. Samsung’s SmartThings platform and Sony’s integration with Google Home represent attempts to make the TV the central hub of the connected home, increasing switching costs for consumers considering alternative brands.
How are Samsung and Sony addressing energy efficiency requirements?
▶
Both manufacturers face increasingly stringent energy efficiency regulations globally. The European Union’s Energy Efficiency Index requirements, set to tighten further in 2025, pose particular challenges for larger, brighter displays. Samsung has implemented its “Eco Mode 2.0” which dynamically adjusts brightness and processing based on ambient light conditions and content type, reducing power consumption by up to 35% compared to standard mode. Sony’s “Power Saving Mode” takes a similar approach but adds AI-based scene detection to optimize power usage without compromising viewing experience. Both companies have also invested in more efficient backlight technologies, with Mini LED offering approximately 20% power savings compared to conventional LED backlighting systems.
What strategies are Samsung and Sony employing against market saturation?
▶
With TV replacement cycles extending to 7-8 years in developed markets (up from 5-6 years a decade ago), both manufacturers face challenges from market saturation. Samsung has responded by expanding into adjacent categories like The Frame and lifestyle TVs, which encourage purchases based on aesthetic considerations rather than technical upgrades. Sony has focused on the premium replacement market, emphasizing significant quality improvements that justify upgrading even functioning older TVs. Both companies have also expanded their commercial display businesses, targeting hospitality, digital signage, and corporate markets where replacement cycles are typically shorter and margins higher.
Conclusion: A Nuanced Market Leadership

The question of who leads the smart TV market between Samsung and Sony defies a simple answer, as each company demonstrates leadership in different dimensions. Samsung unquestionably dominates in terms of market share and manufacturing scale, leveraging vertical integration and quantum dot technology to deliver high-performance displays at competitive price points across all market segments. Its broader product range and global manufacturing footprint provide significant advantages in distribution and cost management.
Sony, while commanding a smaller market share, leads in premium image quality and processing technology. Its strategic focus on high-margin segments and integration with a broader entertainment ecosystem has allowed it to maintain profitability despite lower volumes. Sony’s superior picture accuracy and motion handling continue to set industry standards, particularly for cinematic content.
Looking forward, both companies face similar challenges from Chinese competitors, changing consumer behaviors, and environmental regulations. Their divergent strategies—Samsung emphasizing scale, brightness, and quantum dot technology versus Sony’s focus on processing excellence, OLED technology, and entertainment integration—reflect fundamentally different approaches to addressing these market dynamics.
For industry stakeholders and consumers, understanding these nuanced differences provides valuable context for evaluating each company’s market position and future prospects. Rather than declaring an overall winner, recognizing the specific dimensions where each manufacturer excels offers a more accurate picture of the complex competitive landscape in the global smart TV market.


