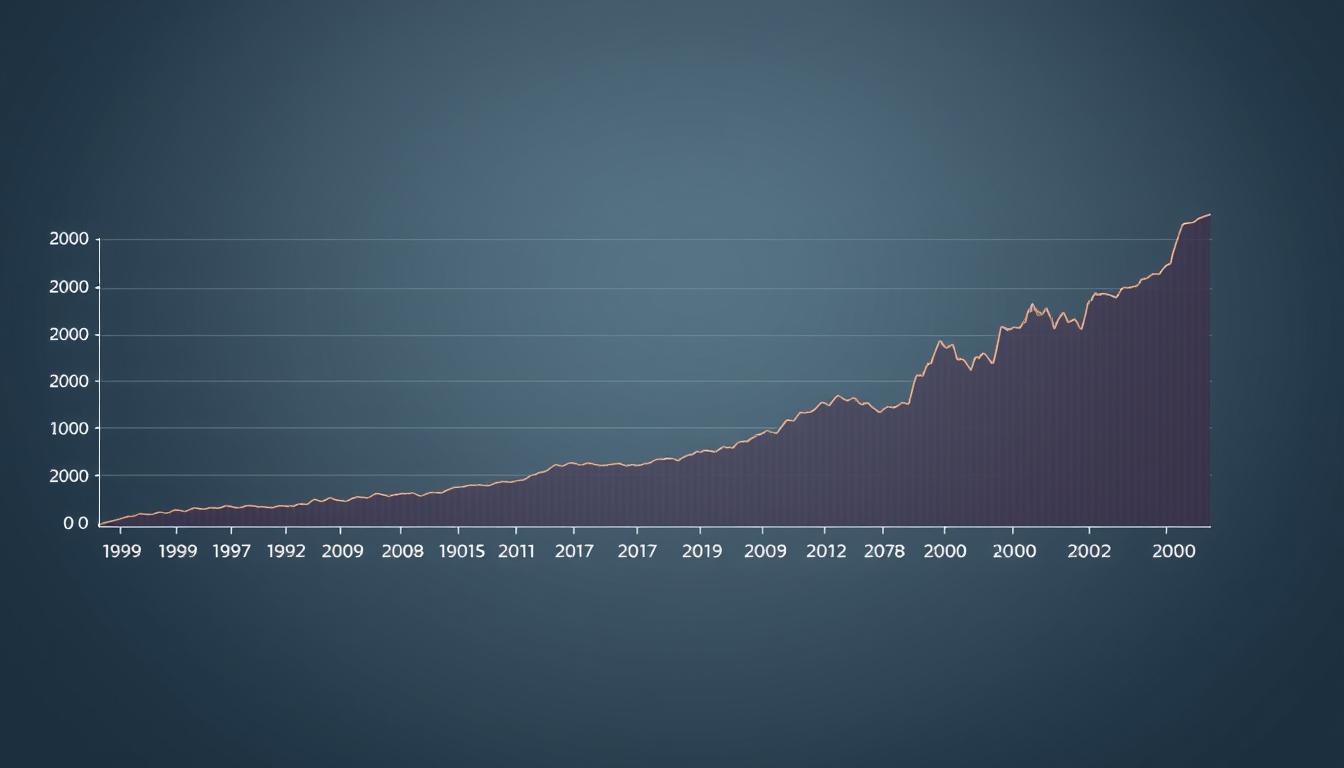
What happens when the world’s largest economy can’t pay its bills? With public debt soaring to $34.62 trillion—a peacetime record—the fiscal landscape faces unprecedented strain. This isn’t just a domestic concern. Every dollar added to the national debt ripples through global markets, shaking investor confidence and reshaping economic priorities.
Rising interest rates amplify the crisis. Higher borrowing costs mean more government spending goes toward servicing debt instead of infrastructure, education, or healthcare. Over time, this cycle threatens economic growth. For instance, debt now exceeds 120% of GDP, limiting flexibility during recessions or emergencies.
Deficits have become a stubborn reality. Tax revenues struggle to keep pace with expenditures, creating a gap that widens yearly. Since 2000, the budget shortfall has tripled, forcing tough choices between austerity and further borrowing. Neither option is painless.
Global markets watch closely. The dollar’s status as a reserve currency hinges on fiscal stability. If faith erodes, foreign investment could dry up, driving rates even higher. Countries reliant on U.S. trade would face collateral damage, from disrupted supply chains to currency volatility.
Key Takeaways
- National debt exceeds $34 trillion, straining budgets and economic stability.
- Higher interest rates increase borrowing costs, diverting funds from critical programs.
- Debt-to-GDP ratios above 120% limit crisis response capabilities.
- Persistent deficits challenge long-term fiscal sustainability.
- Global markets rely on U.S. debt management for currency and trade stability.
Introduction: Navigating a Complex Fiscal Landscape
Decades of policy shifts set the stage for today’s fiscal strain. Since the mid-1970s, government borrowing has surged due to tax reforms, defense expansions, and social programs. Economic crises like 2008 and 2020 accelerated deficits, pushing debt past 120% of GDP—a threshold limiting crisis response flexibility.
Background of U.S. Debt Growth
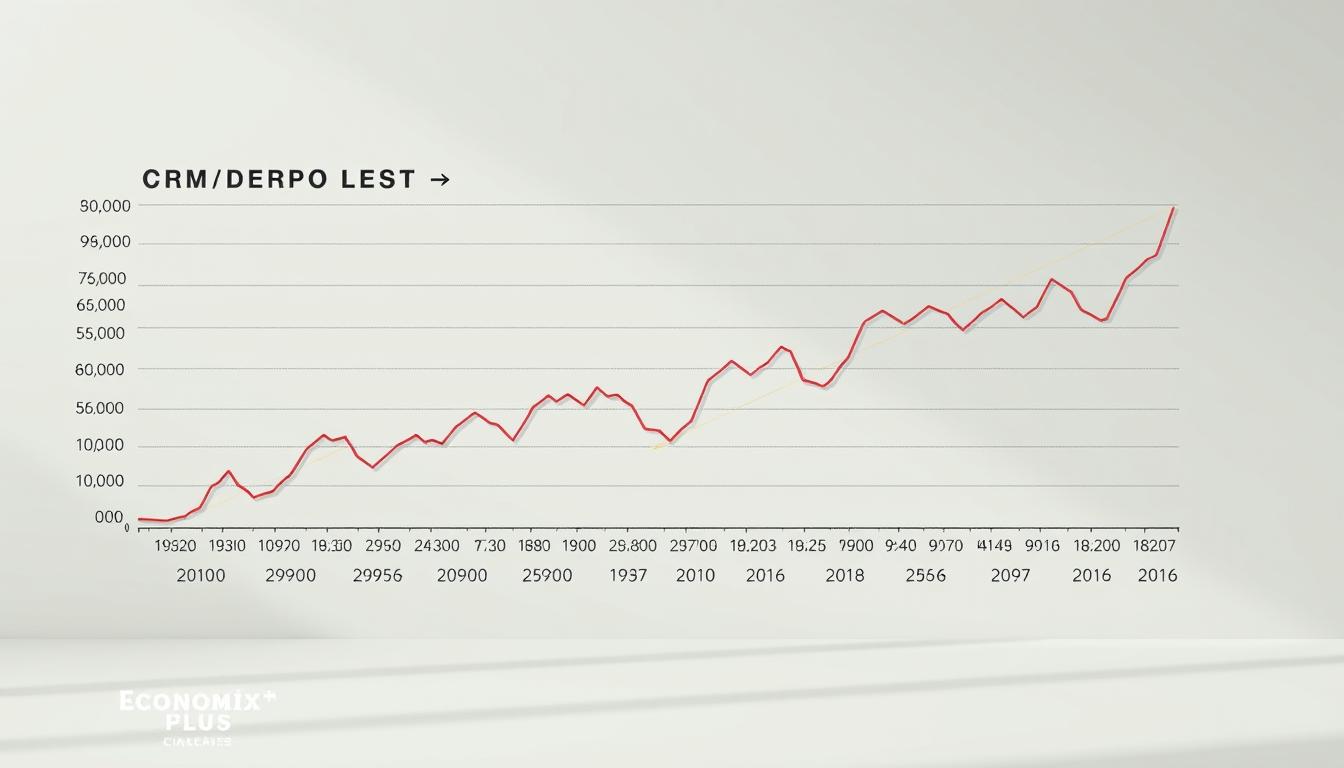
Persistent deficits began after 1974, when budget rules relaxed. Tax cuts in the 1980s and 2000s reduced revenues, while spending on healthcare and pensions rose. By 2023, obligations exceeded $34 trillion—up 400% since 2000. Even during growth years, shortfalls averaged 3.9% of GDP.
Current Economic Indicators and Trends
GDP expanded by 2.1% in 2023, but interest rates hit 5.25%-5.5%, raising borrowing costs. Federal revenues cover only 80% of expenditures, creating a 5.8% deficit. Treasury data shows debt servicing now consumes 15% of the budget—triple 2020 levels.
| Period | Debt-to-GDP | Key Drivers |
|---|---|---|
| 1970s-1980s | 32% → 52% | Tax cuts, defense spending |
| 2000s-2020s | 55% → 120% | Recessions, pandemic relief |
| 2023 | 123% | Rising interest, aging population |
This imbalance strains budgets. Without higher revenues or spending cuts, debt could reach 130% of GDP by 2030. Global markets monitor these trends closely, as stability impacts trade flows and currency valuations.
The US Debt Crisis and Its Impact on the Global Economy
From post-war prosperity to modern gridlock, debt accumulation patterns reveal systemic pressures. Three pivotal moments define this trajectory: 1980s tax reforms, 2008 financial interventions, and 2020 pandemic relief. Each event expanded borrowing while narrowing fiscal flexibility.

Historical Context and Present Challenges
The 1980s saw debt jump 58% after tax reductions and defense expansions. By 2011, political brinkmanship during debt ceiling debates triggered the first credit downgrade. Today, annual shortfalls exceed $1.7 trillion—triple 2019 levels.
Recent standoffs repeat past mistakes. The 2023 debt limit impasse froze $4 trillion in obligations for weeks. Such instability raises borrowing costs. Ten-year Treasury yields climbed to 4.98% in October 2023—the highest since 2007.
How Fiscal Shifts Ripple Through Markets
Global investors now demand higher premiums for holding dollar assets. Foreign ownership of Treasuries dropped to 30% in 2023 from 43% in 2015. This retreat pressures the Federal Reserve to absorb more debt, distorting rate policies.
Emerging economies face collateral damage. When Treasury yields spike, capital flees riskier markets. Brazil’s real lost 12% against the dollar during 2023’s third-quarter volatility.
| Period | Policy Action | Market Reaction |
|---|---|---|
| 2011 | Debt ceiling crisis | S&P downgrade; 15% equity drop |
| 2017 | Corporate tax cuts | Yield curve inversion within 18 months |
| 2023 | Spending standoff | 5% dollar volatility surge |
These patterns confirm a troubling cycle: political delays elevate risks, which then amplify fiscal costs. With deficits projected at 6.1% of GDP through 2025, containment strategies remain elusive.
Key Drivers Behind the Escalating National Debt
Demographic shifts and financial obligations collide as two primary forces accelerating federal deficits. Structural pressures now outweigh temporary economic fluctuations, creating self-reinforcing cycles that challenge budget stability.
Aging Population and Rising Healthcare Costs
Every day, 12,000 Americans turn 65. This demographic wave strains Social Security and Medicare, which consumed 45% of federal spending in 2023. Healthcare expenses alone grew 5.4% annually since 2019—triple inflation rates.
By 2030, 21% of the population will be retirement age. Medicare’s hospital trust fund faces insolvency by 2028. Combined with prescription drug price hikes, healthcare could devour 17.4% of GDP within six years.
Increasing Interest Costs and Deficit Spending
Interest payments now outpace defense spending. Rates above 5% pushed annual debt servicing to $870 billion in 2023—triple 2020 levels. Each percentage point increase adds $2.9 trillion in costs over a decade.
Persistent deficits force continuous borrowing. Last year’s $1.7 trillion shortfall required issuing $5.2 billion in new debt daily. This cycle consumes 15¢ of every tax dollar before funding programs.
| Period | Interest Payments | % of Budget |
|---|---|---|
| 2020 | $345 billion | 6% |
| 2023 | $870 billion | 15% |
| 2030 (Projected) | $1.4 trillion | 22% |
These twin pressures—demographic inevitability and compounding interest—create mathematical certainty. Without structural reforms, mandatory spending and debt costs will consume all federal revenues by 2040.
Implications for Global Markets and U.S. Economic Growth
Mounting fiscal pressures in the world’s largest economy send shockwaves through international markets. As debt levels climb, nations and corporations recalibrate strategies to navigate heightened uncertainty.
Investor Confidence and Market Volatility
Foreign investors now demand higher returns for holding dollar-denominated assets. Treasury bond yields surged to 5.25% in 2023—the highest since 2007—as buyers sought compensation for perceived risks. This “doom loop” accelerates when rising rates inflate debt payments, forcing more borrowing.
Foreign ownership of government securities dropped to 30% last year from 43% in 2015. Reduced demand pressures central banks to absorb excess supply, distorting monetary policies. Equity markets mirrored this anxiety, with the S&P 500 swinging 4% weekly during fiscal standoffs.
Potential Spillover Effects on International Trade
A weaker dollar makes exports cheaper but raises import costs for trade partners. Emerging economies like Brazil saw currencies lose 12% against the dollar during 2023’s volatility spikes. Such shifts disrupt supply chains and pricing models.
Countries relying on dollar-denominated loans face steeper repayment burdens. India’s rupee hit record lows, increasing corporate defaults. Meanwhile, nations stockpiling gold as a hedge reached 15-year highs in reserves.
| Market | 2023 Currency Loss | Bond Yield Increase |
|---|---|---|
| Brazil (Real) | 12% | 1.8% |
| India (Rupee) | 9% | 2.1% |
| South Africa (Rand) | 14% | 1.5% |
These disruptions highlight interconnected risks. Fiscal instability in one nation can paralyze growth across continents. Proactive reforms remain critical to restoring equilibrium.
Fiscal Policy Challenges and Political Dynamics
Political gridlock paralyzes efforts to address unsustainable borrowing trends. Repeated debt ceiling standoffs since 2011 reveal systemic failures in bipartisan cooperation. The 2023 impasse froze $4 trillion in obligations for weeks—a pattern eroding fiscal credibility.
Political Standoffs and Debt Ceiling Debates
Rating agencies sound alarms as governance falters. Fitch downgraded U.S. credit in 2023, citing “repeated debt limit brinkmanship.” Moody’s warns another stalemate could push 10-year Treasury yields above 6%. Lawmakers lack consensus even as interest payments consume 15% of the budget.
| Year | Rating Action | Market Impact |
|---|---|---|
| 2011 | S&P downgrade | 10% stock plunge |
| 2023 | Fitch downgrade | 5% dollar volatility |
| 2024 | Moody’s warning | Yield spike to 5.6% |
Policy Gaps and Future Fiscal Projections
Tax reductions since 2017 widened deficits without matching spending cuts. The Congressional Budget Office projects debt-to-GDP hitting 130% by 2033. Mandatory programs like Social Security face $75 trillion in unfunded obligations over 30 years.
Structural reforms remain absent. Partisan proposals either ignore revenue generation or demand unrealistic austerity. This inertia forces continuous borrowing—$5.2 billion daily in 2023—deepening dependence on volatile foreign investors.
Conclusion
Mounting fiscal imbalances have pushed the United States to a critical juncture. Decades of deficit-driven policies now collide with rising interest rates, creating a self-reinforcing cycle. Servicing $34 trillion in obligations consumes funds once allocated to infrastructure and social programs, eroding long-term growth potential.
Political gridlock exacerbates risks. Repeated debt ceiling standoffs and delayed reforms amplify market volatility. Foreign investors increasingly demand higher yields on dollar assets, threatening the currency’s reserve status. Emerging economies face collateral damage through disrupted trade flows.
Without structural adjustments, projections suggest debt-to-GDP ratios could surpass 130% by 2030. Mandatory spending on entitlements like Social Security will crowd out discretionary investments. Global partners watch closely—prolonged instability risks triggering capital flight and inflationary pressures worldwide.
Sustainable solutions require bipartisan cooperation and data-driven priorities. Addressing demographic shifts and interest costs demands urgent action. The path forward hinges on balancing fiscal responsibility with economic resilience—a challenge defining the nation’s trajectory for generations.
